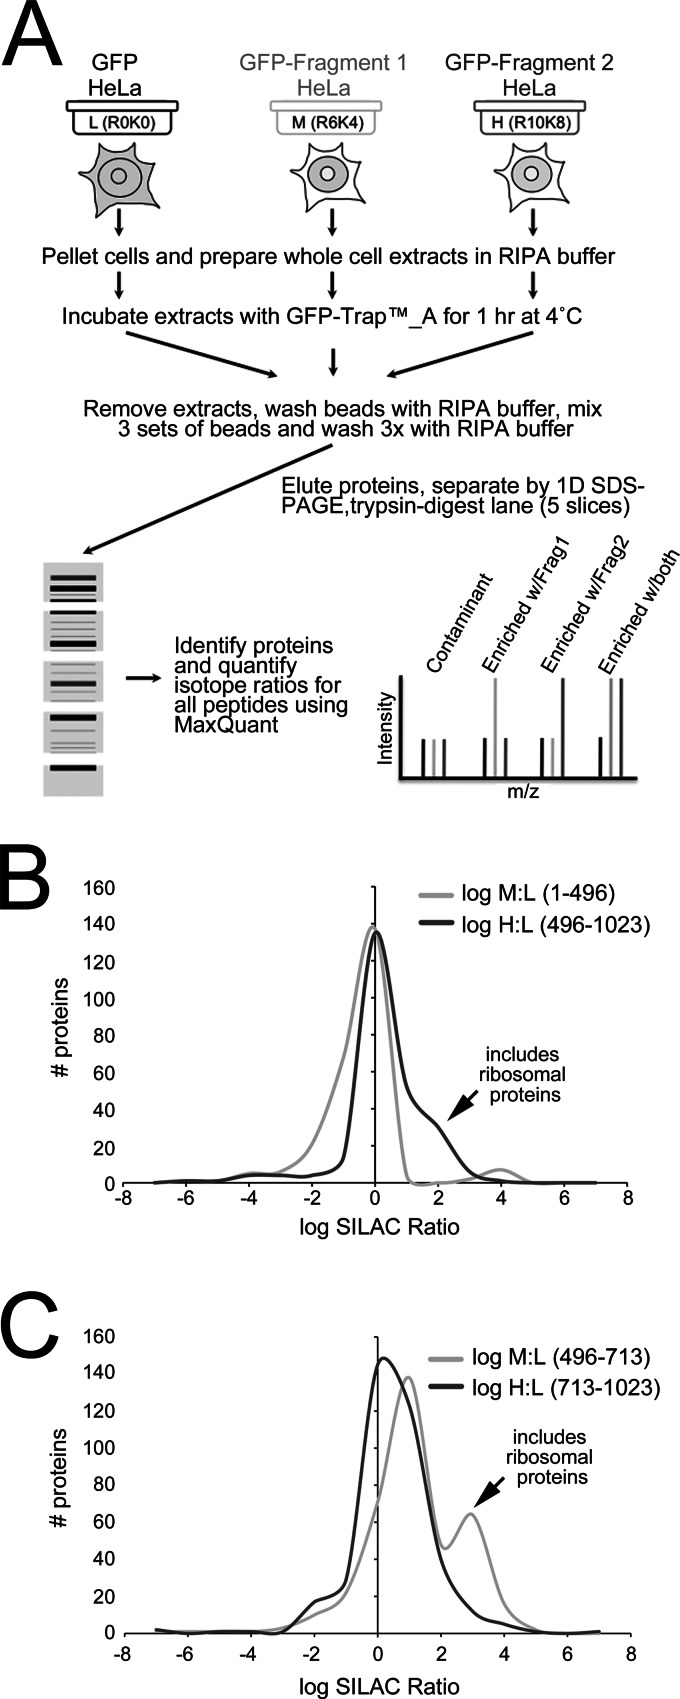
Fig. 3.
Quantitative mapping of RepoMan “fragmentomes.” A, Design of the quantitative IP experiments comparing the interactomes of RepoMan fragments. B, Distribution of log SILAC (M:L and H:L) ratios for the fragmentome experiment comparing GFP-RepoMan/1–496 (M) to GFP-RepoMan/496-1023 (H), with free GFP as the built-in negative control (L). The small peak (arrow) of log H:L ratios (i.e. enriched with 496–1023) that separates from the contaminants (peak over log ratio 0, i.e. ratio 1:1) contains enriched ribosomal proteins. C, Distribution of log SILAC (M/L and H/L) ratios for the fragmentome experiment comparing GFP-RepoMan/496–713 (M) to GFP-RepoMan/713–1023 (H), with free GFP as the built-in negative control (L). The peak (arrow) of log M:L ratios (i.e. enriched with 496–713) that separates from the contaminants (peak over log ratio 0, i.e. ratio 1:1) contains enriched ribosomal proteins.

