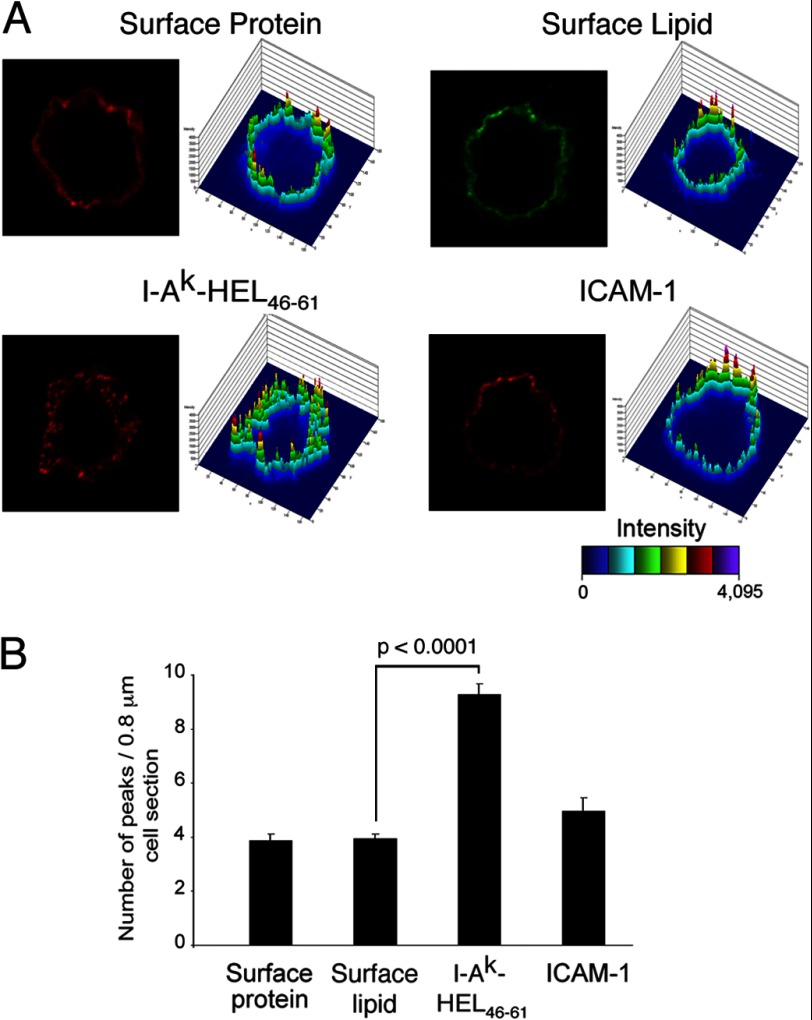
FIGURE 2.
I-Ak-HEL(46–61) complexes are clustered on the DC surface. Immature DCs were incubated in medium containing 1 mg/ml HEL for 12 h, washed, and activated with LPS for 12 h, and surface proteins were then biotinylated on ice. Cells were incubated on ice with either Alexa Fluor 564-labeled avidin or Alexa Fluor 564-labeled cholera toxin to illuminate surface protein or lipid, respectively. Other cells were stained live with mAb recognizing I-Ak-HEL(46–61) complexes or ICAM-1 as indicated. A, a representative image and 2.5D plot of each stain is shown. B, the number of peaks visualized in each 0.8-μm-thick optical section was quantitated. The data shown are the mean ± S.D. from at least 45 individual cells from at least three independent experiments.

