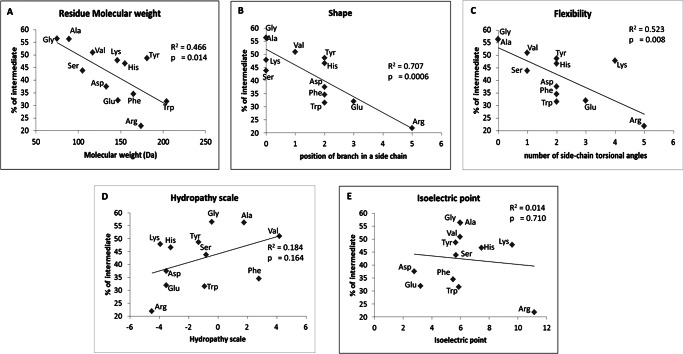
FIGURE 5.
The coefficient of determination (R2) and regression line for percentage of intermediate generation (Table 1) versus selected properties (Table 2) of single amino acid residue substituents in Ala10. A, residue molecular mass; B, shape; C, flexibility; D, hydrophobicity; E, isoelectric point. The R2 and the p values are shown in each plot.

