
FIGURE 2.
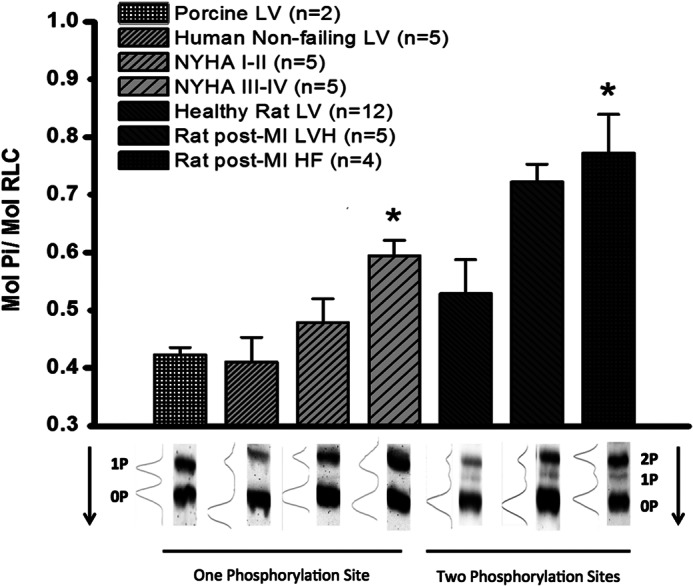
Top, SDS-PAGE Phos-tagTM analysis of cRLC phosphorylation level in mol of phosphate/mol of cRLC. cRLC phosphorylation was measured in left ventricular tissue from porcine, human, and rat samples. Samples from human left ventricular tissue taken from patients were categorized as moderate (NYHA I or II (n = 5)) or severe heart failure (NYHA III or IV (n = 5)) or normal donor (Human Non-failing LV, n = 5). Normal rat left ventricular tissue (Healthy Rat LV, n = 12) was compared with rat LV 4 weeks post-chronic MI (Rat post-MI LVH, n = 5) and 20 weeks post-chronic MI (Rat post-MI HF, n = 4). All data are displayed as mean ± S.E. (error bars). *, significance of p < 0.05 compared with control. Bottom, representative Western blots showing the ratio of phosphorylation and the amount of phosphorylation sites in each organism. Arrow, direction of blot. 2P, 1P, and 0P, the number of RLC sites phosphorylated for each band.