
FIGURE 3.
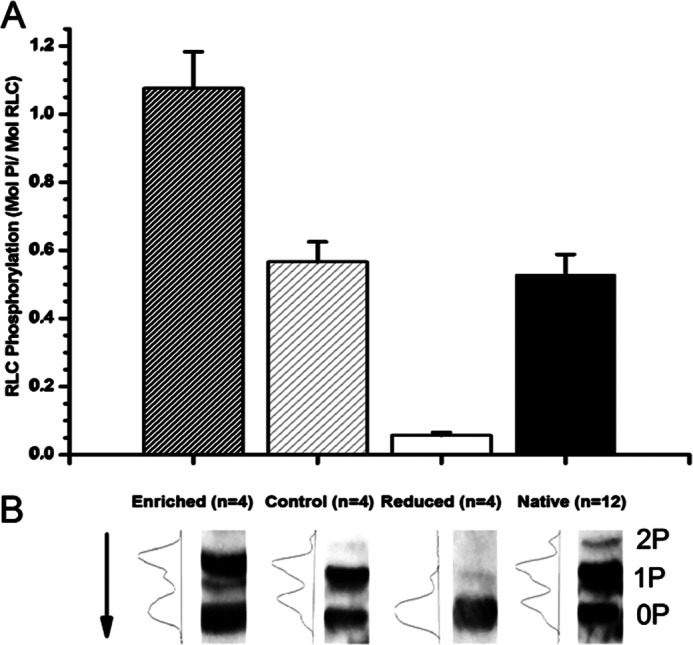
A, bar plot indicating the phosphorylation level of differently phosphorylated rat rRLC species generated by incubation with kinases (Enriched), shrimp alkaline phosphatase (Reduced), or a mixture of the two mimicking native RLC phosphorylation levels (Control). Native trabecular phosphorylation level is displayed for comparison (Native). All data are plotted as mean ± S.E. (error bars), and n values are given for each preparation. B, representative Western blots of differently phosphorylated rRLC species. Arrow, direction of blot. 2P, 1P, and 0P, number of RLC sites phosphorylated.