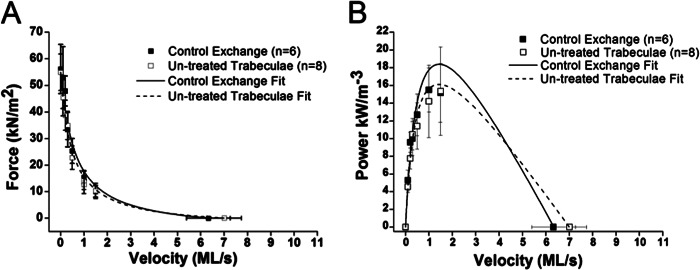
FIGURE 5.

A, FV relationships of untreated trabeculae (n = 8) compared with trabeculae that have undergone control exchange (n = 6) with rRLC species of similar to native levels of RLC phosphorylation. Force was measured during the plateau phase for the individual fixed shortening velocity. Relations are fit with Hill's hyperbolic equation. All points are means of force produced during shortening ± S.E. (error bars). B, PV relations calculated from FV relations of untreated trabeculae (n = 8) compared with control exchange (n = 6). All data are presented as power ± S.E. This fitting procedure fits the relationship between force during shortening and shortening velocity in muscle lengths (ML)/s. Microsoft Excel solver was used to minimize the sum of the squared error between observed and expected values of force. The Vmax measurements obtained by the slack test method constrain the fitting procedure.
