
FIGURE 6.
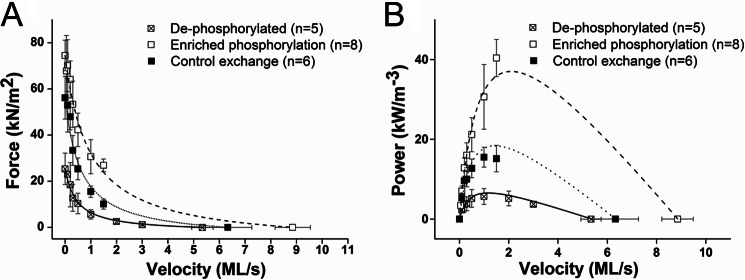
A, FV relationships of trabeculae that have undergone exchange with rRLC species that are hyperphosphorylated (n = 8), have control phosphorylation similar to native RLC phosphorylation (n = 6), and are dephosphorylated (n = 5). B, calculated PV relationships of trabeculae that have undergone exchange with the three species of rRLC phosphorylation. All data are plotted as mean ± S.E. (error bars). ML/s, muscle lengths/s.