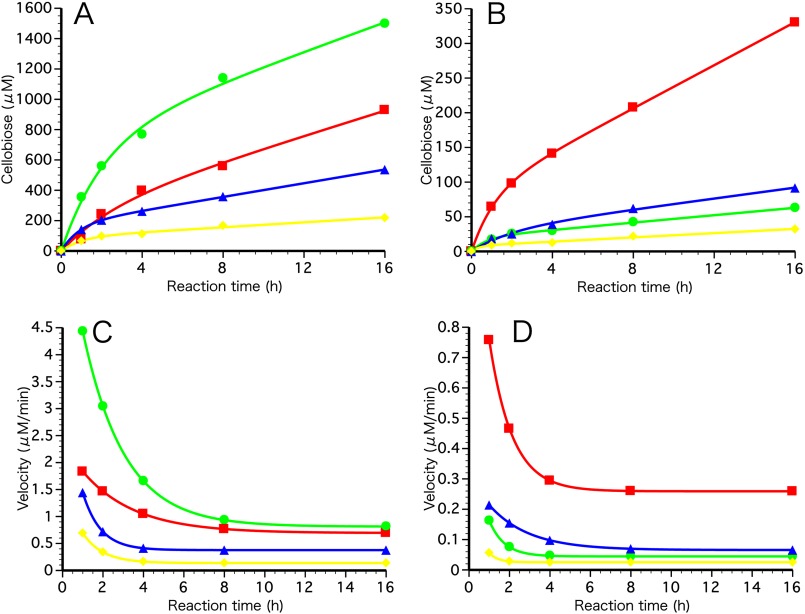
FIGURE 2.
Progress curves and product (cellobiose) velocity curves of cellulose hydrolysis by WT, W40A, WTcat, and W40Acat. PASC (A) and HCC (Cladophora spp.; B) were incubated at 27 °C in 50 mm sodium acetate (pH 5.0) with 1.4 μm each enzyme at a 0.1% (w/v) substrate concentration. Duplicate assays were performed at each time point. Soluble products were determined by the p-hydroxybenzoic acid hydrazide method using cellobiose as a standard as described under “Experimental Procedures.” Red squares, WT; green circles, W40A; blue triangles, WTcat; yellow diamonds, W40Acat. Cellobiose production velocities were calculated from progress curves on PASC (C) and HCC (D).

