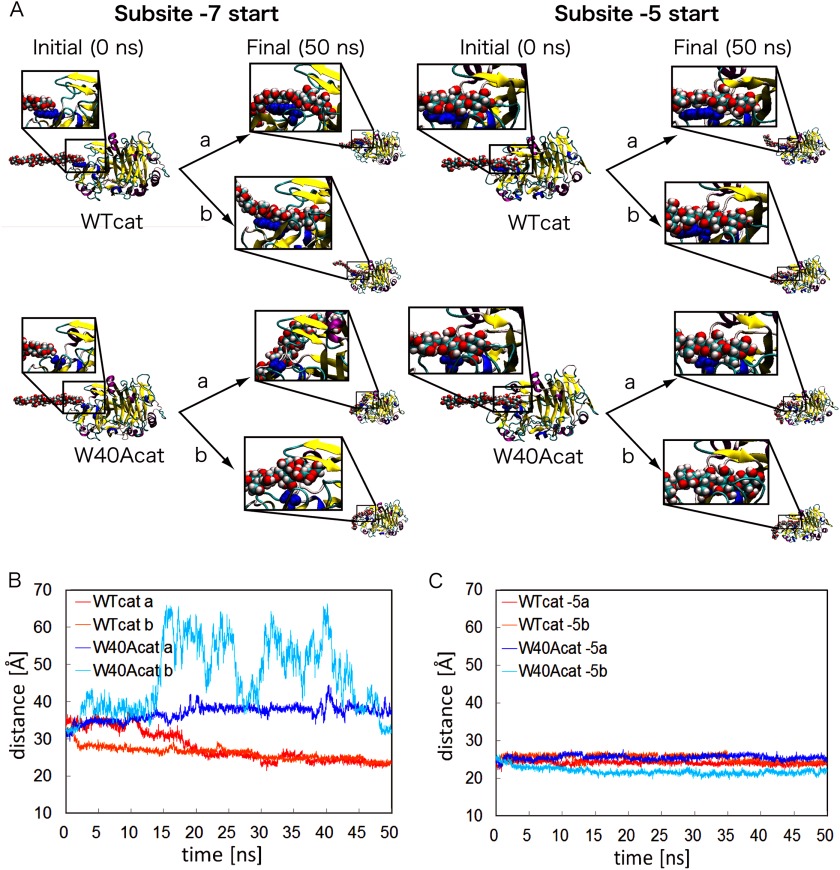
FIGURE 3.
Initial and final snapshots of WTcat and W40Acat with cellononaose and the distances between cellononaose and the catalytic site in the molecular dynamics simulations. The reducing end glucose of cellononaose was initially placed at subsite −7 or −5 of WTcat and W40Acat. Simulations were performed twice (trials a and b) for each enzyme. Initial and final structures are depicted in the close-up views (A). The distances between the catalytic residue Glu-212 and the reducing end glucose of cellononaose during the simulations for subsites −7 and −5 are plotted in B and C, respectively.

