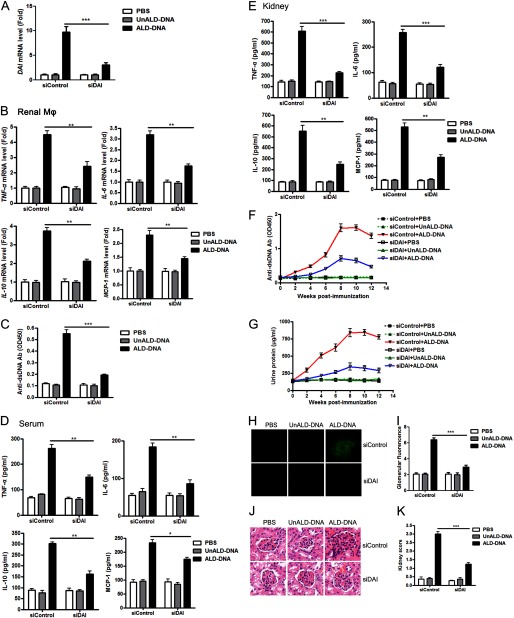
FIGURE 9.
Knockdown of DAI in vivo alleviates SLE syndrome accompanied with blunted renal macrophage activation and decreased inflammatory response in lupus mice. ALD-DNA-immunized lupus mice were treated with siDAI or siControl. PBS- and UnALD-DNA-immunized mice were used as controls. A, real-time PCR analysis of the DAI mRNA level in renal macrophages purified from siDAI-treated lupus mice or siControl-treated lupus mice at week 12 after initial immunization. B, at week 12 after initial immunization, mRNA levels of TNF-α, IL-6, IL-10, and MCP-1 in the renal macrophages purified from the mice were evaluated by real-time PCR. C, at week 12 after the initial immunization, the purified renal macrophages from the siDAI-treated or siControl-treated lupus mice were cocultured with CD4+ T cells and CD19+ B cells from the SLE mice, then stimulated with ALD-DNA for 6 days. Levels of anti-dsDNA IgG in the culture supernatants were analyzed by ELISA. D, at week 12, levels of TNF-α, IL-6, IL-10, and MCP-1 in serum of the mice were determined by ELISA. E, at week 12, kidney tissue was collected and homogenized, the expressions of TNF-α, IL-6, IL-10, and MCP-1 were determined by ELISA. F, serum anti-dsDNA Ab level every 2 weeks were measured by ELISA. G, urine protein levels of mice were assessed by the BCA Protein Assay kit. Data in A-G are mean ± S.E. of three independent experiments, n = 8. H, 12 weeks after the initial immunization, glomerular immune deposition was detected by direct immunofluorescence for IgG in frozen kidney section of mice. Representative images (magnification ×200) of 10 mice are shown for each group. I, mean glomerular fluorescence intensity (arbitrary units) was determined for IgG in siDAI-treated lupus mice and siControl-treated lupus mice at week 12 after the initial immunization, n = 10. **, p < 0.01. J, 12 weeks after initial immunization, nephritic pathology was evaluated by H&E staining of renal tissues. Images (magnification ×200) are representative of at least 10 mice in each group. K, the kidney score was assessed using paraffin sections stained with H&E in J. ***, p < 0.001.

