FIGURE 1.
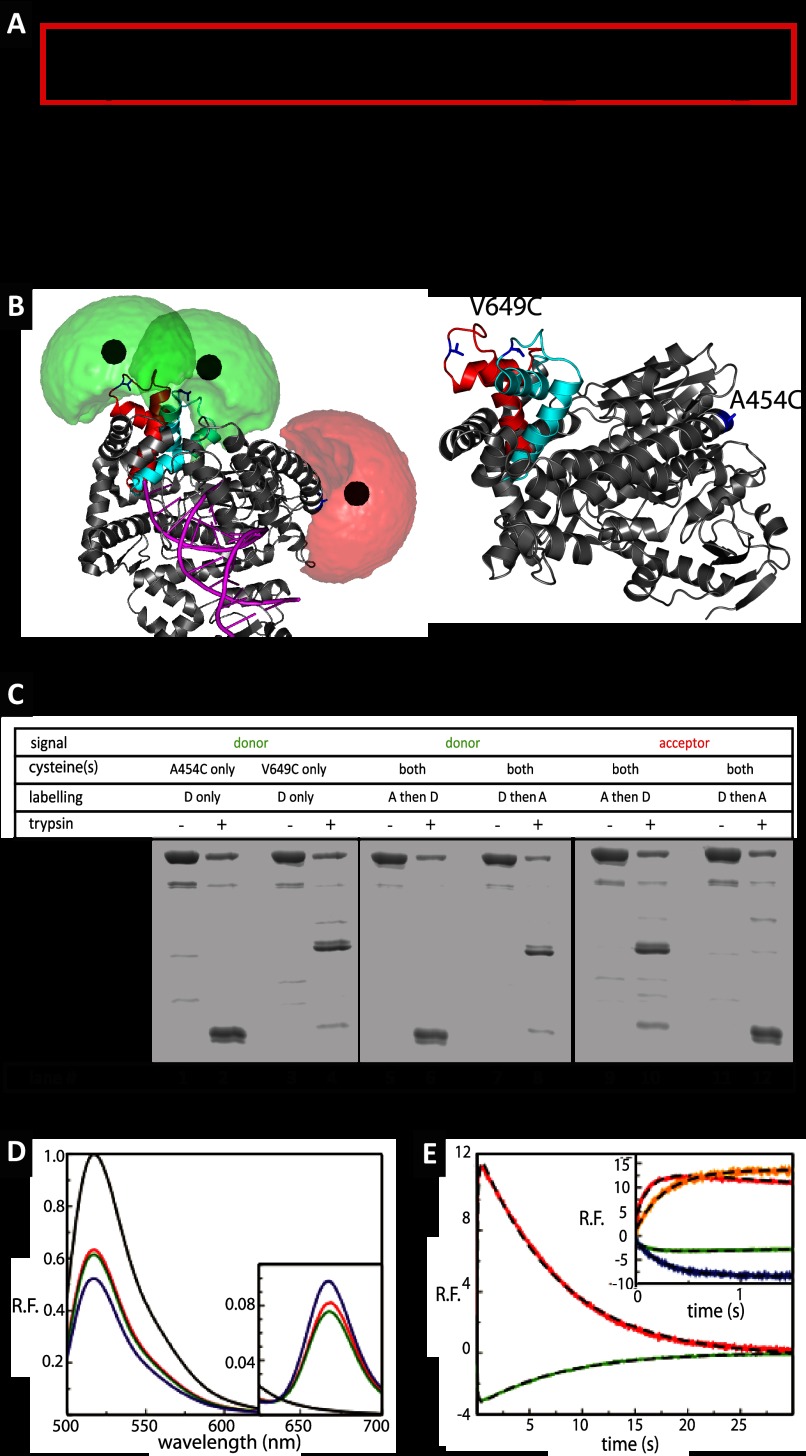
Polymerase cycle and ensemble level results. A, general basic model for the DNA polymerase reaction cycle, see text for description, as described in a classical Michaelis-Menten framework. The red box indicates the parts in which conformational selection dictates the expansion of the scheme to include additional conformational states (“catalytic network” paradigm). B, structure of KTDA. Crystal structure of Klentaq1 in complex with DNA shown in gray schematics fitted inside the surface (gray) with DNA shown in magenta. The change in position of the O-helix is shown in red for the E:p/t complex and in cyan for the closed complex (E:p/t:dNTP(correct)). Fluorophore clouds are shown in green for Alexa 488 and red for Alexa 647 with the mean positions shown as solid spheres. For calculated distance changes, see main text and Table 1. An alternative view of the structure is also displayed for highlighting the positions of the amino acids in blue used for labeling. C, fluorescence scans of an SDS-PAGE before or after limited proteolysis of labeled KT with 2 μg/ml trypsin. Digestion of the labeled single mutants KTA454C[A488] (lanes 1 and 2) and KTV649C[A488] (lanes 3 and 4) reveals product bands diagnostic of the labeling position (V649C band and A454C band). When KTV649C/A454C is labeled with acceptor first and then the donor, the vast majority of the donor appears in the A454C band (lanes 5 and 6), and the vast majority of the acceptor appears in the V649C band (lanes 9 and 10). Conversely, when KTV649C/A454C is labeled with the donor first and then the acceptor, the donor predominantly localizes to the V649C band (lanes 7 and 8), whereas most of the acceptor is in the A454C band (lanes 11 and 12). It can thus be concluded that the V649C position is more accessible to fluorophores and is preferentially labeled by whichever fluorophore is added first. D, steady state fluorescence emission spectra of doubly labeled Klentaq1, KTV649C[A488]/A454C[A647], with various substrates, after excitation of the donor at 493 nm. The spectra for E, E:p′/t′:ddGTP, and E:p′/t′:ddGTP with the addition of the next correct dNTP (dCTP) are shown in red, green, and blue, respectively. The spectrum of donor only, KTV649C[A488], is shown in black for direct comparison. Inset shows close-ups of the wavelength range in which acceptor emission is recorded. E, results of stopped flow data of dCTP incorporation by the pre-formed binary complexes of KT:primary/template at 20 °C. Relative fluorescence emission of the donor (green) and acceptor (red) after excitation of the donor after mixing pre-formed binary complexes KT:p′/t′ with dCTP leading to incorporation events. The corresponding fits are given with dashed black line. The incorporation data are described by two exponentials (dashed line), with the rates of fingers closure at 7.52 and 7.78 s−1, and the rates of opening at 0.125 and 0.131 s−1 for donor and acceptor, respectively (see inset for comparison). Inset, difference between incorporation and binding. The results presented in the main graph are shown again (green and red curves) for a direct comparison with the results obtained for dTTP binding to the terminated p/t DNA. In this case, a single exponential describes the kinetics with the donor (blue line) and acceptor rates (orange line) of 3.55 and 3.51 s−1, respectively.

