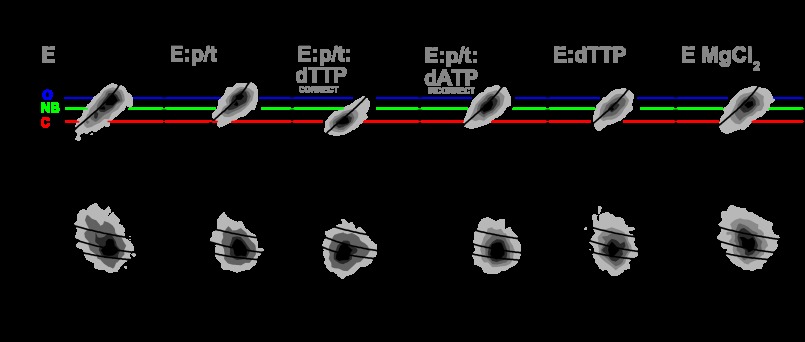
FIGURE 2.
Frequency histograms of single-molecule bursts for KTDA under various conditions. Frequency is shown as an increasing gray scale from white to black normalized to the same number of events. In the upper panel, donor lifetime, τD(A), is plotted versus FD/FA (see “Experimental Procedures”). Direct excitation of the acceptor is negligible. The black line shown is the static FRET line described under “Experimental Procedures.” In the lower panel, donor lifetime, τD(A), is plotted versus donor anisotropy, rD, together with three overlaid curves computed from the Perrin equation, using a value for fundamental anisotropy of r0 = 0.37 and a mean rotational correlation time, ρD, of either 0.7, 1.5, or 4 ns. The mean FD/FA value of the different species are indicated with a blue line (open, O), a green line (nucleotide binding, NB), and a red line (closed, C).

