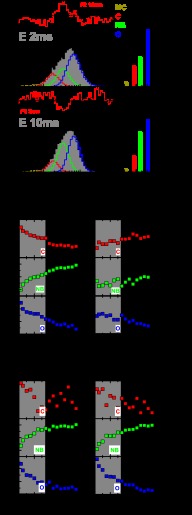
FIGURE 5.
Time window analysis. A and B, data (gray bar histogram) obtained for KTDA for a 2-ms time window and a 10-ms time window with states of interest colored as in Fig. 3. Residuals are shown above each fit for the correct model (black) or when using a 10-ms fit for a 2-ms t.w. or a 2-ms fit for a 10-ms t.w. (red). C and D, mean distances and % of each are indicated by bar diagrams of the same color as well as the % of donor only and contaminant (D-o+C) shown in black. E–P, relative amplitudes for C, NB, and O are plotted against varying widths of time windows and are shown in red, green, and blue, respectively, for the various measurements. A shaded area acts as a guide for the direct separation of the two time scales of the recovered decays (fast, 1–5 ms; slow, 10–100 ms; see text for details). E–G, free enzyme; H–J, E:p/t:dTTPCorrect; K–M, free enzyme + high Mg2+; N–P, E:p/t−dATPIncorrect.

