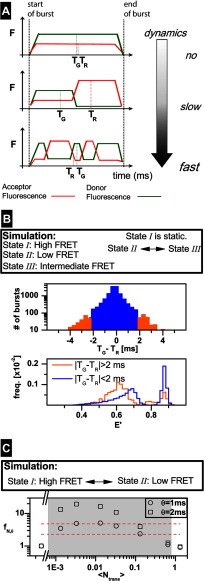
FIGURE 6.
Slow dynamics burst enrichment procedure for KTDA. A, time scale of dynamics is defined with respect to the mean burst duration, 〈tbd〉. The top panel shows a burst in which no transition is occurring. For this case |TG − TR| is close to 0 ms. The middle panel shows a burst in which only one transition occurs. During detection time, the donor fluorescence (green) decreases and the acceptor fluorescence (red) increases. The average detection time for the photons constituting the green, TG, and red, TR, trace within the burst are shifted toward opposite directions. The lower panel shows a burst, in which many transitions are occurring. Also for this case |TG − TR| is close to 0 ms. B, simulated data of freely diffusing molecules (state 1, high FRET; state 2,: low FRET; state 3, intermediate FRET). State 1 is static, whereas transitions occur between state 2 and state 3. Upper panel, selection of bursts based on |TG − TR| criterion. Lower panel, normalized histograms of FRET efficiencies as calculated for each burst. For the case of bursts with |TG −TR| >2 ms (orange), the static part (High FRET state) is suppressed in comparison with the histogram of all bursts with |TG − TR| <2 ms. C, series of simulated data of freely diffusing molecules exhibiting dynamics between 2 states (state I, high FRET; state II, low FRET). For each case, the corresponding fN, θ is given (for definition see Equation 11), for θ = 1, 2 ms, as a function of the mean number of transitions per burst over the overall detected bursts 〈Ntrans〉. The total rate, ktotal of the transitions was varied, from 0 to 40 s−1, whereas the equilibrium constant remained unchanged. The mean burst duration, 〈tbd〉, was 32.8 ms. The shaded region illustrates the range for which SD burst enrichment is useful (see “Experimental Procedures” for details). The red dashed lines indicate the region in which fN, θ, obtained from measurements on KT, was found.

