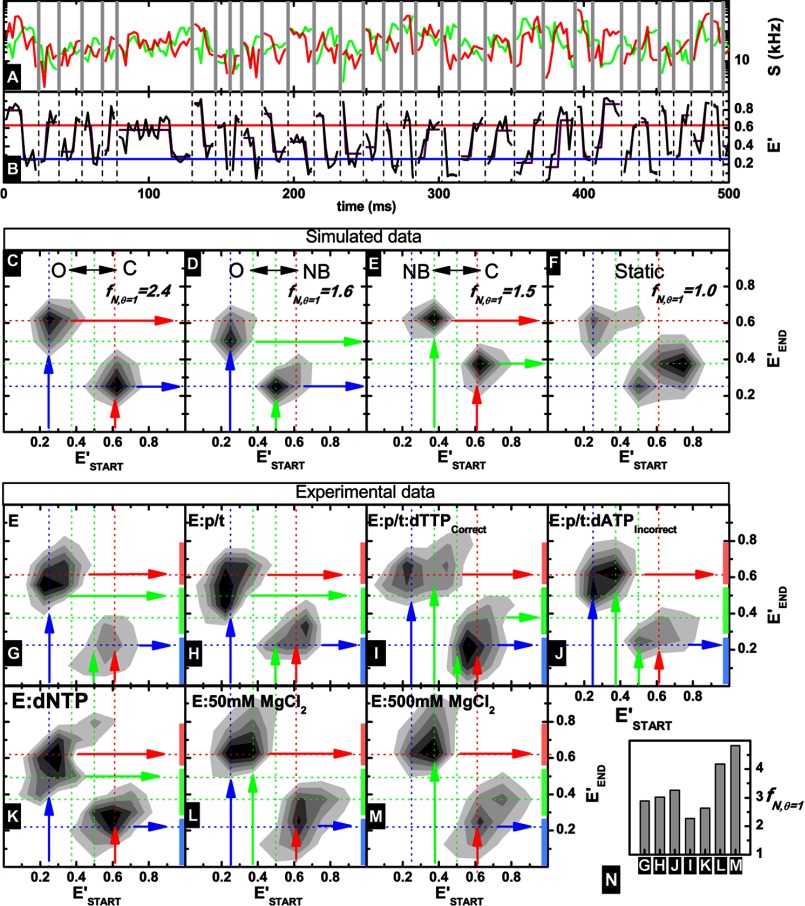
FIGURE 7.
Slow transition data obtained for KTDA under various conditions. A, green and red fluorescence intensity traces recovered from fluorescent bursts (using time windows of 1 ms) are shown in corresponding colors, with different bursts separated by gray vertical lines. B, uncorrected efficiency traces of burst fragments (black) with HaMMy fit shown in purple. The mean fitted efficiency for O and C is also indicated in red and black, respectively. C–F, transition matrices (with E′START and E′END as defined in the main text) obtained from fitting of simulated data using HaMMy for an O-C transition (C), O-NB transition (D), C-NB transition (E), and no transitions (F). For a complete description see text. Also indicated are the originating states shown in blue, green, and red vertical arrows for O, NB, and C, respectively, although the state after a transition is shown as a horizontal arrow in the same colors. Guide lines for O, NB, and C are shown in blue, green, red dotted lines, respectively. For each case the corresponding fN, θ = 1 is given (for definition see Equation 11) as a measure of the effectiveness of the SD burst enrichment (see text for details). G–M, transitions matrices obtained for indicated experimental data. A transition, from or to, a single state is indicated by an arrow (blue for O, green for NB, and red for closed). The length of the vertical bars along the y axis of each plot are representative of the uncertainty in the determination of the FRET level of each state (closed, light red; nucleotide binding, light green; and open, light blue). N, fN, θ = 1 values for all measurements. It is clear that in all cases more transitions are registered than in the case of the simulated static system.

