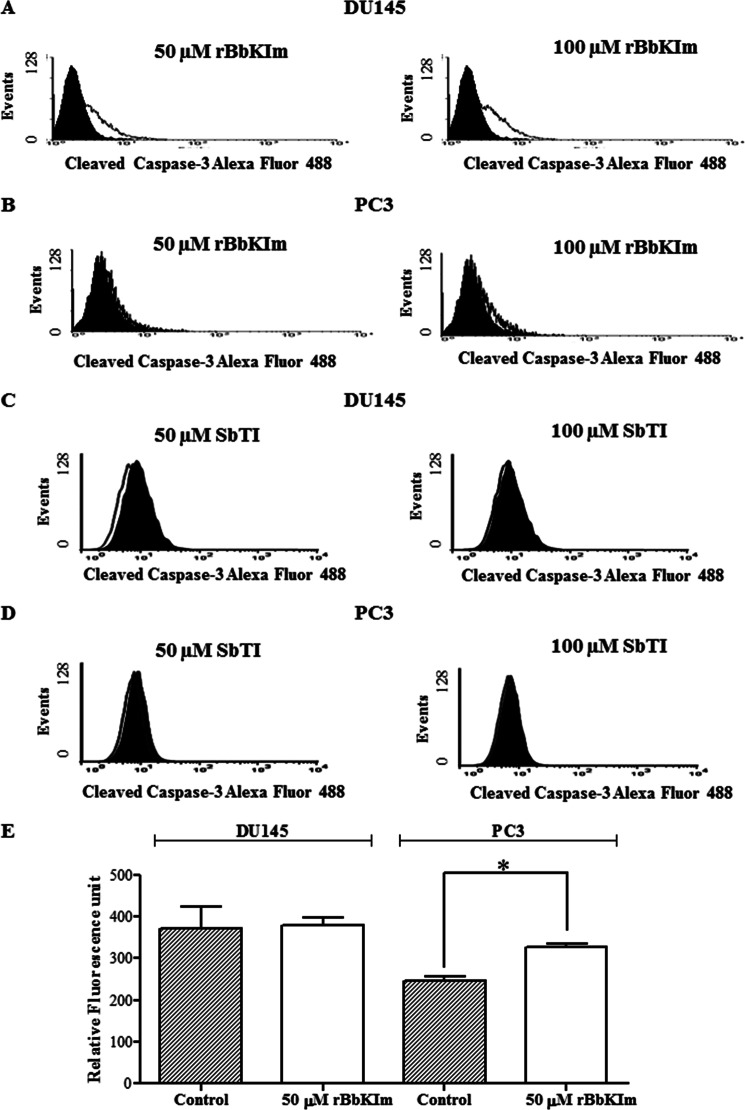
FIGURE 4.
Analysis of the activation of caspase-3 and caspase-9. The caspase activity and activation were investigated by a fluorescence assay and flow cytometry. A–D, flow cytometric analysis of the endogenous levels of activated caspase-3 in DU145 and PC3 cells treated with rBbKIm (A and B) and SbTI (C and D) 50 and 100 μm. The filled and open histograms represent unstimulated and stimulated samples, respectively. E, caspase-9 activation assay was performed by incubation of the substrate LQHD-AFC 20 mm with cellular lysate at 37 °C for 4 h (λexc = 400 nm and λem = 505 nm). The values are expressed as the means ± standard deviation of a representative experiment performed in triplicate. Significant differences versus controls are presented (t test; *, p < 0.05).

