
FIGURE 11.
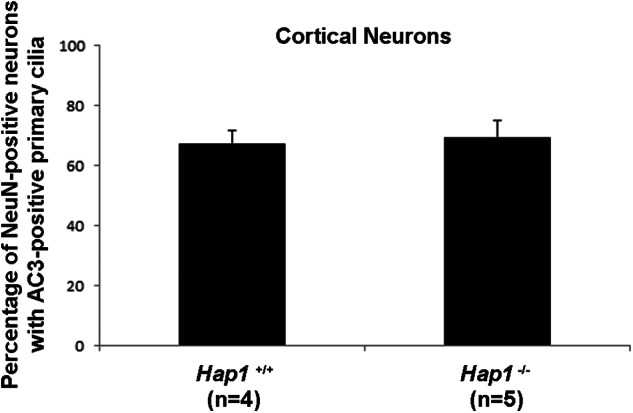
Hap1-deficient cortical neurons display normal cilium formation as assessed by AC3 immunolabeling. Quantification of the number of NeuN-positive cortical neurons that had AC3-positive primary cilia. A minimum of least 100 neuronal cells per coverslip per genotype were assayed (comparing Hap1+/+ and Hap1−/− cerebral cortical cultures). Error bars represent the S.E.