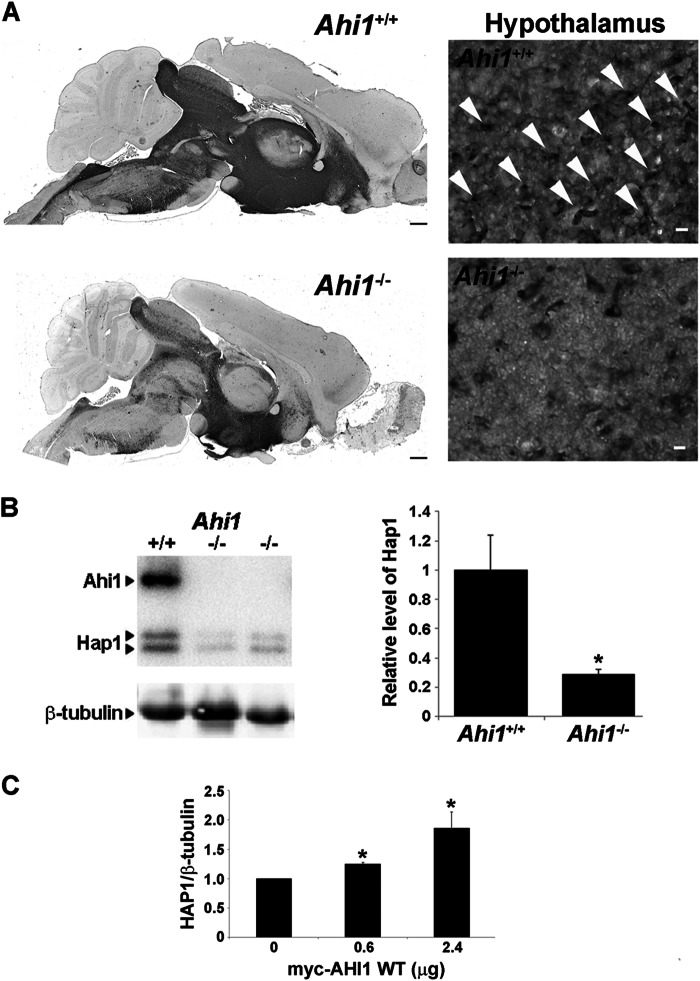
FIGURE 12.
AHI1 stabilizes HAP1. A, brain midsagittal sections from Ahi1+/+ and Ahi1−/− mice immunostained with Hap1 showing a reduction in Hap1 levels in the absence of Ahi1. Scale bar = 500 μm. Higher magnification images of the hypothalamus showed the absence of stigmoid bodies in Ahi1−/− tissue. Arrowheads point to some of the stigmoid bodies. Scale bar = 10 μm. B, Hap1 levels in brains from Ahi1−/− and Ahi1+/+ mice were analyzed by Western blot and graphically displayed. β-Tubulin III was used as a loading control. Hap1 levels were decreased in Ahi1−/− brains compared with Ahi1+/+ (p < 0.05). Results are expressed as mean ± S.E. (n = 4). C, PC12 cells were transfected with increasing amounts of myc-AHI1-WT (human) and lysed after 24 h. Myc-AHI1-WT and Hap1 levels were analyzed by Western blot using β-tubulin as a loading control. Results are expressed as mean ± S.E. (n = 3). Asterisk denotes significance from control (non-transfected) (p < 0.05).

