FIGURE 2.
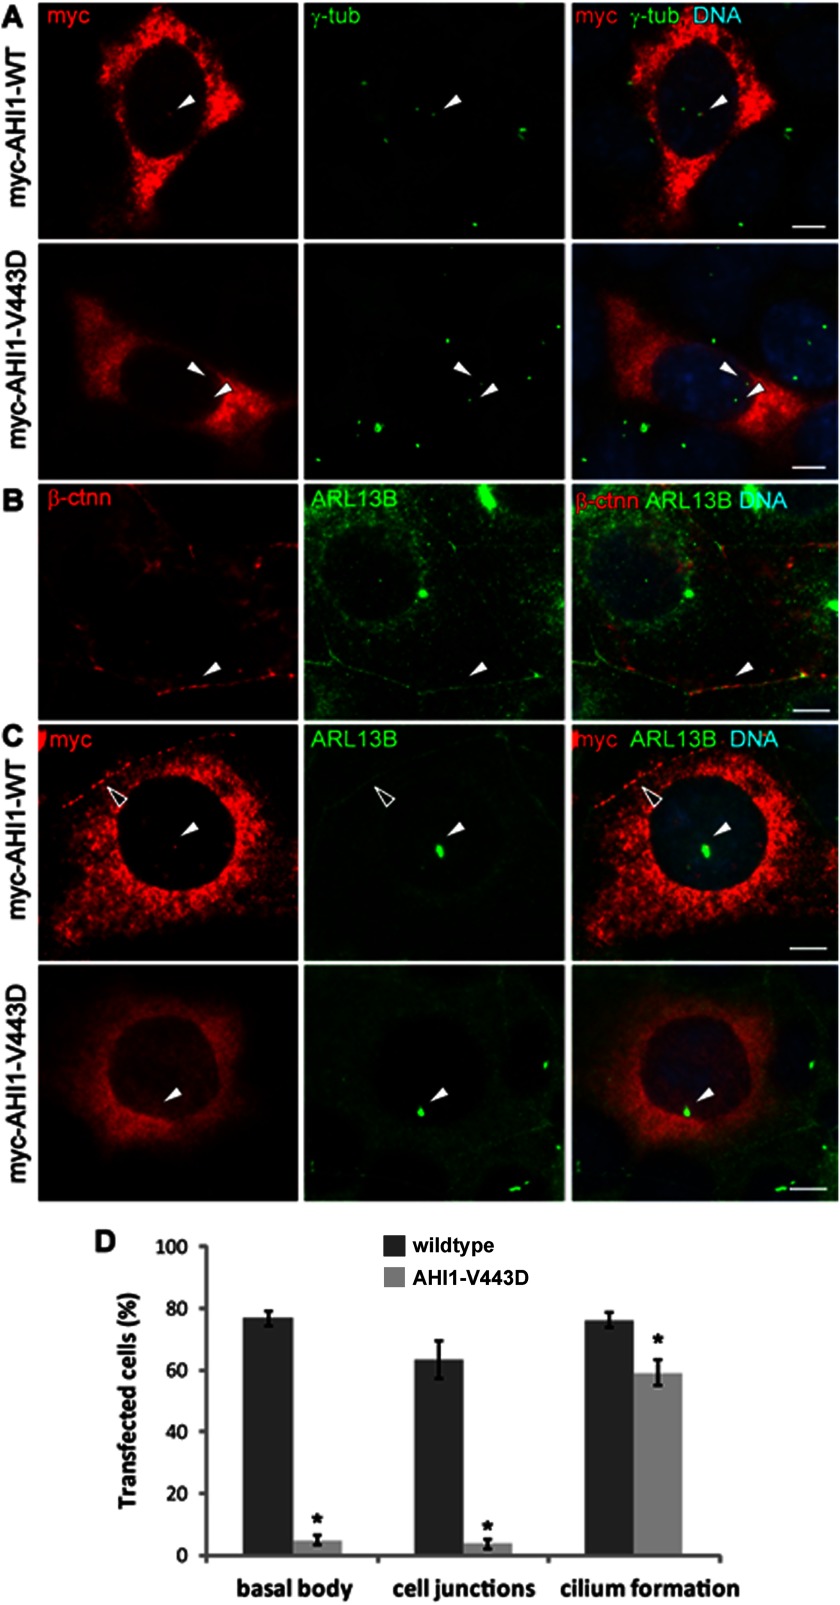
Loss of AHI1 distribution at the basal body and cell-cell junctions with the JBTS-associated AHI1-V443D mutation. A, myc-tagged full-length AHI1-WT or AHI1-V443D was transiently expressed in IMCD3 cells and the co-localization of transfected proteins (myc, red) and the centrosome (γ-tub, green) was evaluated by immunostaining. The arrowheads point to the co-localization of γ-tubulin and AHI1 in AHI1-WT cells at the basal body (top), with no co-localization of AHI1 and γ-tubulin in AHI1-V443D cells (bottom). B, Arl13b staining (green) is co-localized with β-catenin (β-ctnn; red) at cell junctions (arrowhead) indicating that Arl13b is a good marker for cell-cell junctions. C, transfected cells were cultured in serum-free medium to examine the distribution of transfected proteins (myc, red) at cell junctions and the basal body of primary cilia (Arl13b, green). Co-localization of transfected AHI1 and Arl13b was found at the basal body (white arrowhead) and cell junctions (open arrowhead) in AHI1-WT cells, but not in AHI1-V443D cells. Scale bars = 5 μm. D, the graph represents the percentage of transfected AHI1 protein, localized at the basal body and cell junctions, as well as the incidence of cilia formation in these transfected cells. Results were collected from ≥3 independent transfection assays and more than 100 transfected cells were counted from each coverslip. The error bar represents the S.E. Asterisks denote the significance from AHI1-WT transfected cells (basal body co-localization, p < 0.0001; cell junction distribution, p < 0.0001; cilium formation, p < 0.02).

