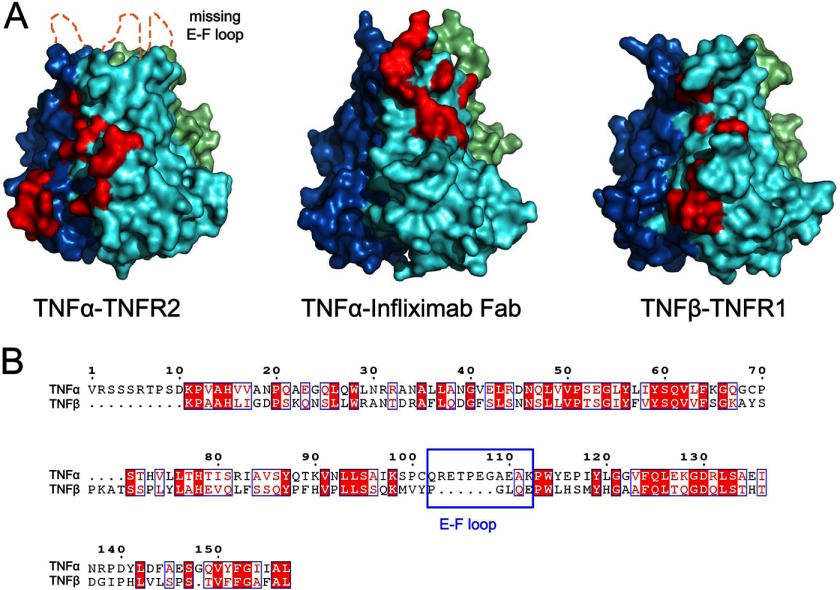
FIGURE 2.
Comparison of the interface between TNFα and receptors and infliximab Fab. A, TNFα from the complex structures is represented as a colored surface with TNFR2 and the infliximab Fab interface highlighted in red at one of three interfaces on the TNFα trimer. The E-F loop region, which is missing in the TNFα-TNFR2 complex because of the lack of interaction, is labeled. The TNFβ from the TNFβ-TNFR1 complex structure is shown as a colored surface with one of the TNFR1-binding sites highlighted in red. All TNF molecules are superposed and presented in the same orientation. B, the amino acid sequence alignment of TNFα and TNFβ. The E-F loop, which may play a central role in antibody-antigen interaction, is framed. The numbering of residues (top) refers to that in TNFα.

