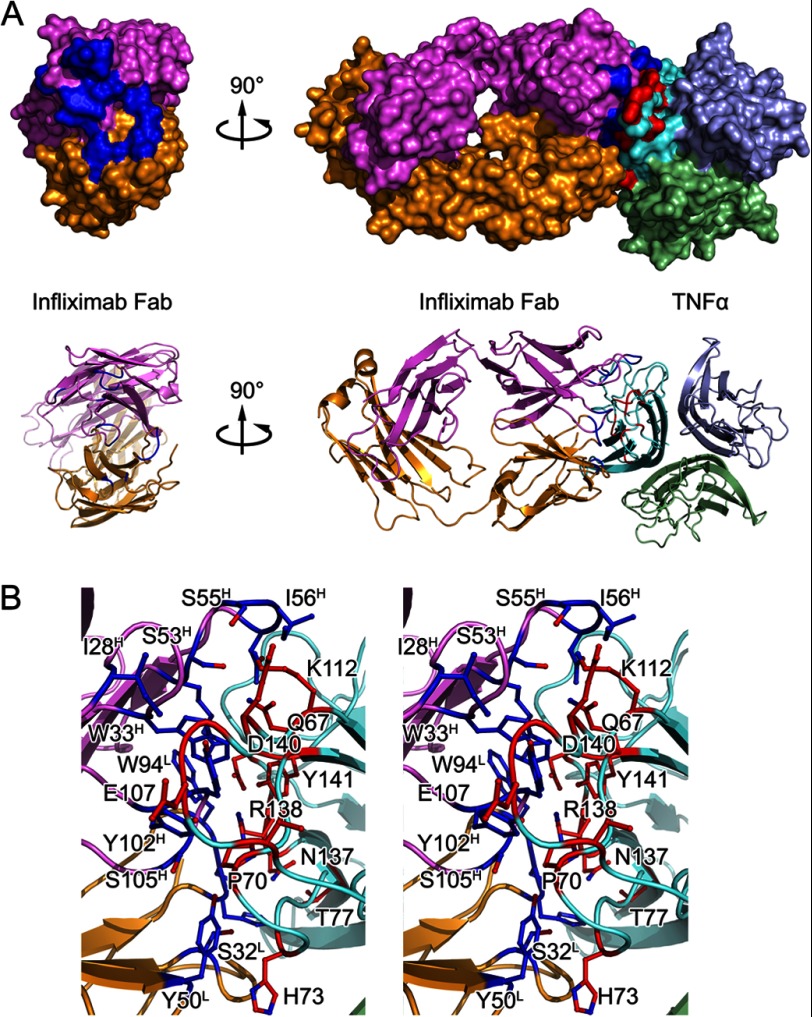
FIGURE 3.
Detailed TNFα-infliximab Fab interface. A, surface representations and ribbon diagrams of infliximab Fab (left) and the TNFα-infliximab Fab complex (right). The light chain and heavy chain of infliximab Fab are colored gold and magenta, respectively. The TNFα trimer is colored cyan. The contact surfaces (≤3.6 Å) are highlighted in blue on infliximab Fab and red on TNFα. Ribbon diagrams corresponding to the surfaces shown above with the same color scheme. B, stereoview of the TNFα-infliximab Fab interface. The residues that are involved in the intermolecular interaction are shown as colored sticks with the same scheme as the surface representation above. Infliximab Fab and TNFα molecules are presented as ribbon diagrams.

