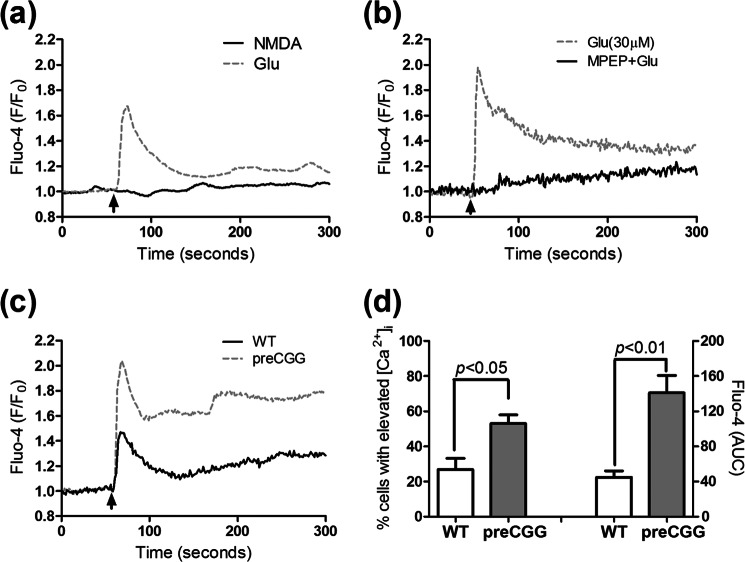
FIGURE 10.
Influence of Glu receptor agonist or antagonist on the Ca2+ dynamics in WT or preCGG cortical astrocytes. a, lack of Ca2+ response of NMDA in preCGG cortical astrocytes (solid black line). Glu (30 μm) was used as a positive control (gray dotted line). b, An mGluR5 antagonist, MPEP (10 μm) suppressed the Glu (30 μm)-induced intracellular Ca2+ increase in preCGG cortical astrocytes. The astrocytes were incubated with MPEP for 10 min before the addition of Glu (arrowhead). These data were repeated twice in triplicates with similar results. c, representative traces of type I mGluR receptor agonist DHPG (2 μm)-induced intracellular Ca2+ increase in both WT and preCGG cortical astrocytes. Black solid trace, WT; gray dotted trace, preCGG. These data were repeated twice in duplicates with similar results. d, quantification of the percentage of cells with sustained intracellular Ca2+ increase as well as Ca2+ response (area under the curve, AUC) after WT and preCGG cortical astrocytes were exposed to 2 μm DHPG. These data were from two independent cultures in duplicates.

