
FIGURE 11.
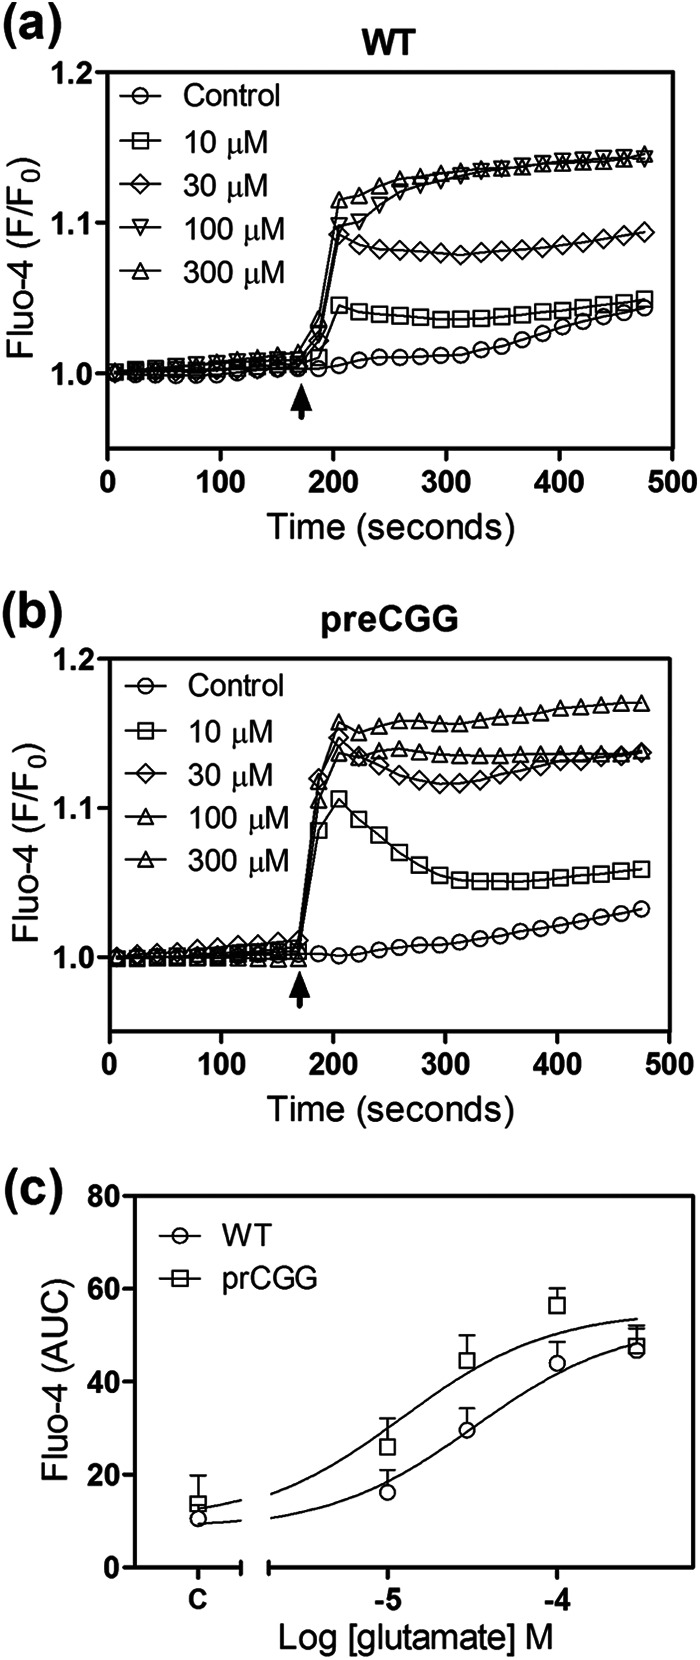
PreCGG cortical astrocytes are more sensitive to Glu exposure measured in a population level. a and b, Glu-induced Ca2+ response in WT (a) and preCGG (b) cortical astrocytes (error bars are omitted for clarity). c, concentration-response relationships for Glu-induced Ca2+ response (area under the curve, AUC) in WT and preCGG cortical astrocytes. Each data point represents mean ± S.E. (n = 8). The experiments were repeated three times, and the EC50 values were 35.23 ± 2.80 and 12.94 ± 3.89 μm (n = 3, p < 0.05) for Glu-induced Ca2+ response in WT and preCGG cortical astrocytes, respectively.