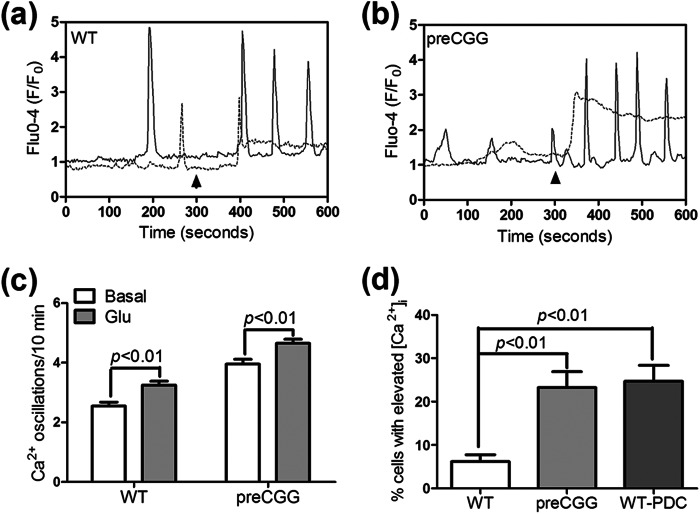
FIGURE 9.
Influence of Glu on the Ca2+ dynamics in WT and preCGG cortical astrocytes. a and b, representative traces for Glu (10 μm) stimulation of Ca2+ response in WT (a) and preCGG (b) cortical astrocytes. Glu stimulated two distinct Ca2+ responses in both WT and preCGG cortical astrocytes. Some cells displayed more Ca2+ oscillations (solid trace), whereas the remaining responsive cells displayed sustained intracellular Ca2+ increase (dotted trace). Arrowheads indicate the addition of Glu (10 μm). c, quantification of the spontaneous Ca2+ oscillations before and after 10 μm Glu treatment. A concentration of 10 μm Glu increased the spontaneous Ca2+ oscillations in both WT and preCGG astrocytes. Each data point represents the mean ± S.E. from at least 150 cells for each group. d, quantification of the percentage of cells with sustained intracellular Ca2+ increase after treatment with 10 μm Glu in vehicle or 10 μm l-trans-PDC-exposed WT astrocytes and preCGG cortical astrocytes. Each data point represents the mean ± S.E. from at least 4 wells.

