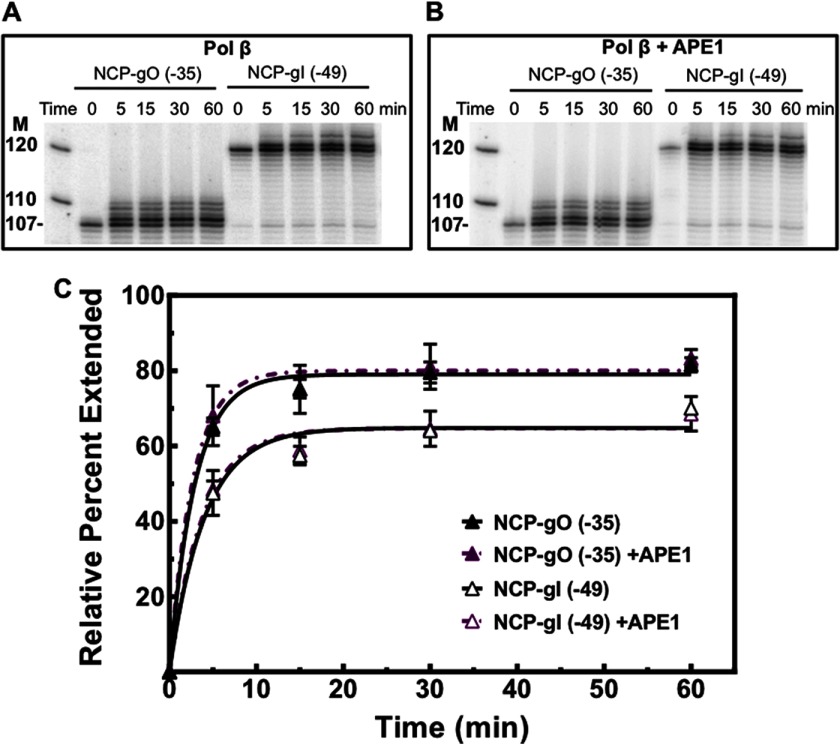
FIGURE 8.
Polymerase β extension activity in NCPs near DNA ends. A, representative gels for NCP-gO (−35) and NCP-gI (−49) pol β (100 nm) extension in the absence of APE1. B, NCP-gO (−35) and NCP-gI (−49) were incubated with pol β and APE1 at 100 and 10 nm, respectively, for the specified times. C, plot of the mean ± 1 S.D. of three independent experiments normalized to the maximum pol β extension on their respective free DNAs, which was performed at an enzyme concentration of 200 nm for 60 min at 37 °C. Normalized data points were fitted as described under “Experimental Procedures.” The initial rates were calculated for extension in the absence of APE1 with values of 27.1 ± 2.0 and 16.1 ± 2.1% extended per min for NCP-gO (−35) and NCP-gI (−49), respectively. Data points where the error bars are not visible, the standard deviations were smaller or similar in magnitude to the size of the symbols.

