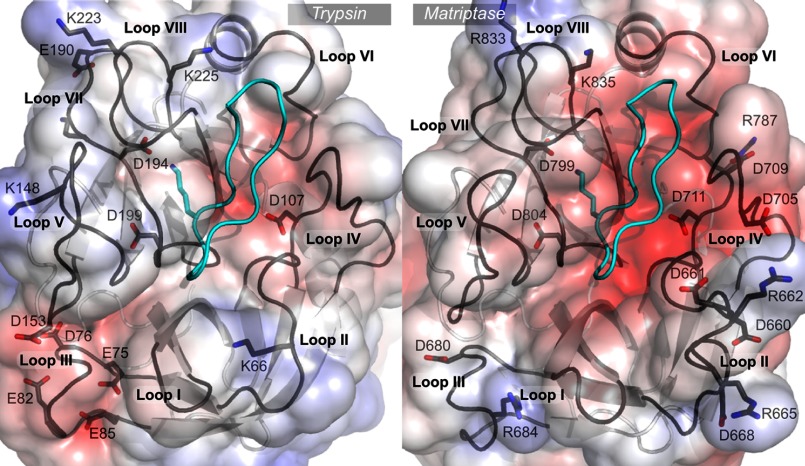
FIGURE 1.
Comparison of trypsin and matriptase active sites. The crystallographic structures of SFTI-1 in complex with trypsin (PDB code 1sfi) and in complex with matriptase (PDB code 3p8f) are represented. The protein backbone of SFTI-1 is in cyan and the functional Lys is displayed in stick representation. The eight loops that surround the active sites are named loops I to VIII. The solvent accessible surfaces of the proteases are colored according to the Poisson-Boltzmann electrostatic potential they generate, as computed by the APBS software (49), with a scale ranging from −5 kT/e (red) to +5 kT/e (blue). The charged positions in each loop are highlighted. The numberings of trypsin and matriptase positions are according to the sequence of bovine trypsin (UniProt P00760) and human matriptase SP1 (Q9Y5Y6), respectively. The figure was generated using PyMol.

