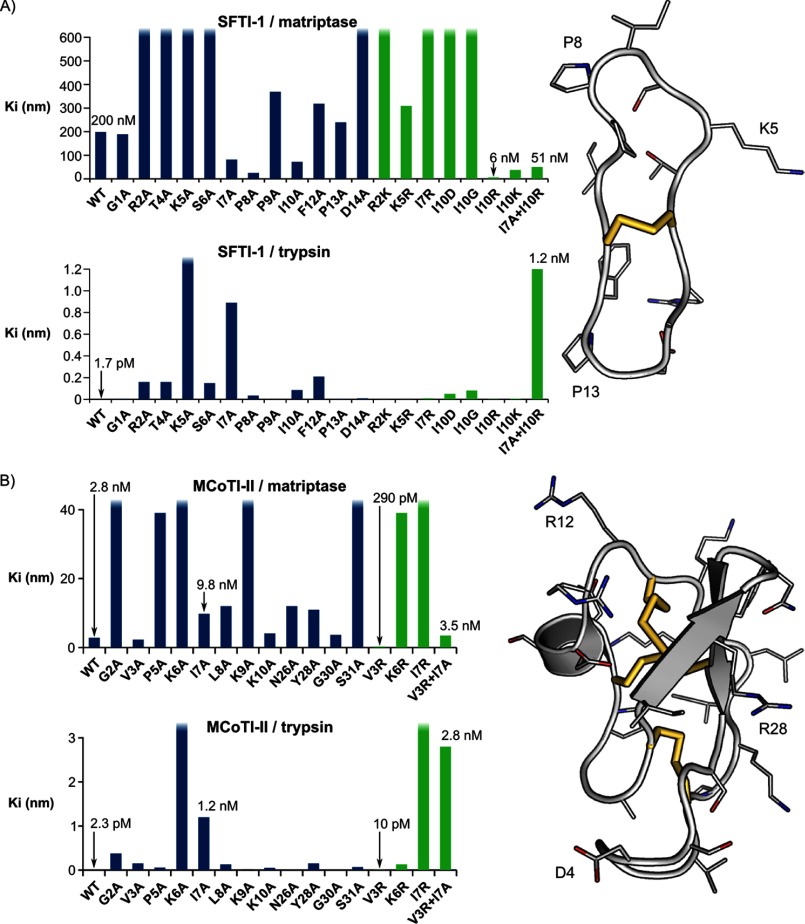
FIGURE 4.
Comparison of the differences in inhibitory activity of the SFTI-1 (A) and MCoTI-II (B) mutants relative to the native peptides. The side chains are highlighted on the structures shown on the right of the diagram. The disulfide bonds are shown as yellow sticks. The surface diagrams were generated using PyMol.

