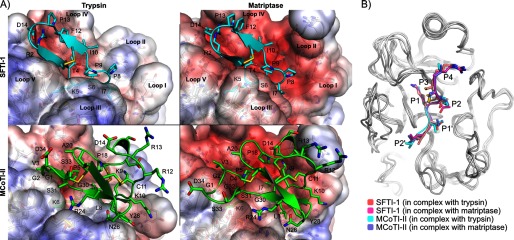
FIGURE 5.

A, binding modes of SFTI-1 (cyan) and MCoTI-II (green) in the active sites of trypsin (left) and matriptase (right). The three major differences between the active sites of trypsin and matriptase are the longest and more charged loop II of matriptase, the different conformation of loop III and the more negatively charged loop IV of matriptase. The structures in this figure are the final conformations of 20-ns molecular dynamics simulations carried out for each complex. SFTI-1 and MCoTI-II adopted similar binding modes in the two protease active sites, but MCoTI-II displayed more conformational variability than SFTI-1. The solvent accessible surfaces of the proteases are colored according to the Poisson-Boltzmann electrostatic potential they generate, as computed by the APBS software (49), with a scale ranging from −5 kT/e (red) to +5 kT/e (blue). B, comparison of the binding modes of the inhibitory loops of SFTI-1 and MCoTI-II when they are in complex with matriptase and trypsin. The backbones of the proteases are shown in white using schematic representations, and the inhibitory loops are in schematic and stick representations. The proteases were superimposed using PyMol. The remaining parts of the SFTI-1 and MCoTI-II beside the inhibitory loops are not shown.
