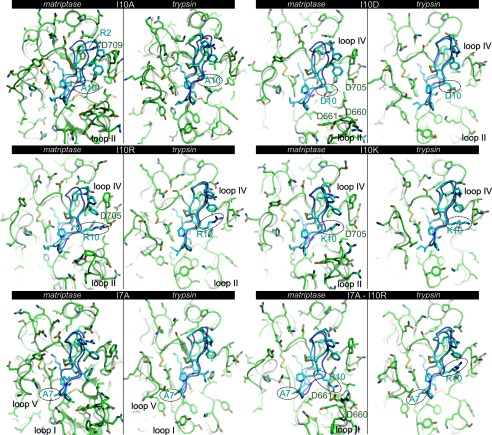
FIGURE 6.
Comparison of the binding modes of six SFTI-1 variants modeled in the matriptase and trypsin active sites. The models of the variants were generated by comparison using the structure of the complexes with wild-type SFTI-1 and were simulated by molecular dynamics for at least 5 ns. The proteases in the mutated complex are shown in green using schematic and stick representations, and the SFTI-1 variants are shown in cyan using schematic and stick representations. The structures of the corresponding complexes but without mutations are shown in transparency with the backbone of SFTI-1 in violet and the proteases in white. The mutated position is circled, and residues and loops discussed in the text are highlighted.

