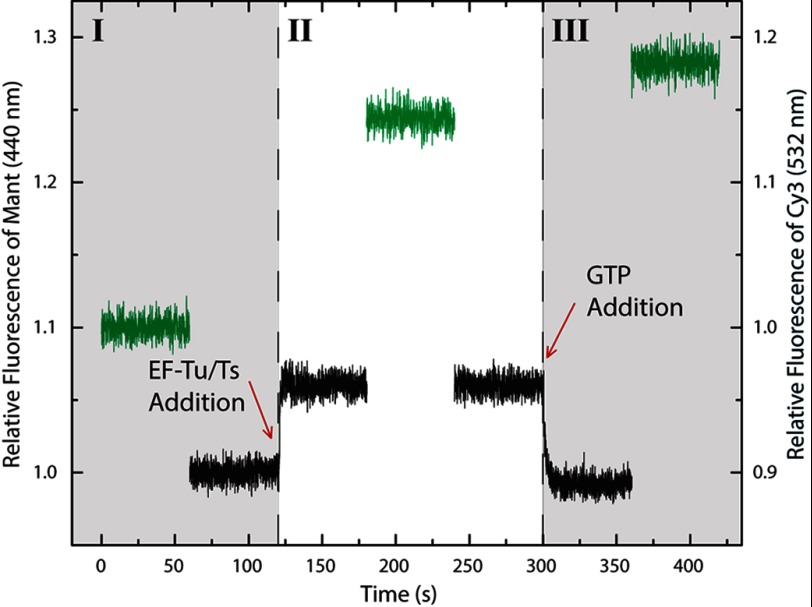
FIGURE 6.
EF-Ts directly facilitates ternary complex turnover. Region I, the relative fluorescence intensities of Cy3 (green; right axis) and mant (black; left axis) obtained from a solution containing 400 nm Phe-tRNAPhe (unlabeled), 5 nm Phe-tRNAPhe (Cy3-acp3U47), and 10 μm mant-GTP in the absence of factor. Region II, the increase in mant fluorescence intensity (black; left axis) and Cy3 fluorescence intensity (green; right axis) resulting from addition of 400 nm EF-Tu·EF-Ts to the mixture. Region III, addition of saturating amounts of unlabeled GTP (100 μm) resulted in a rapid decrease (kturnover = 0.6 ± 0.03 s−1) in the mant signal (black; left axis), whereas the Cy3 signal (green; right axis) exhibited a small increase in intensity.

