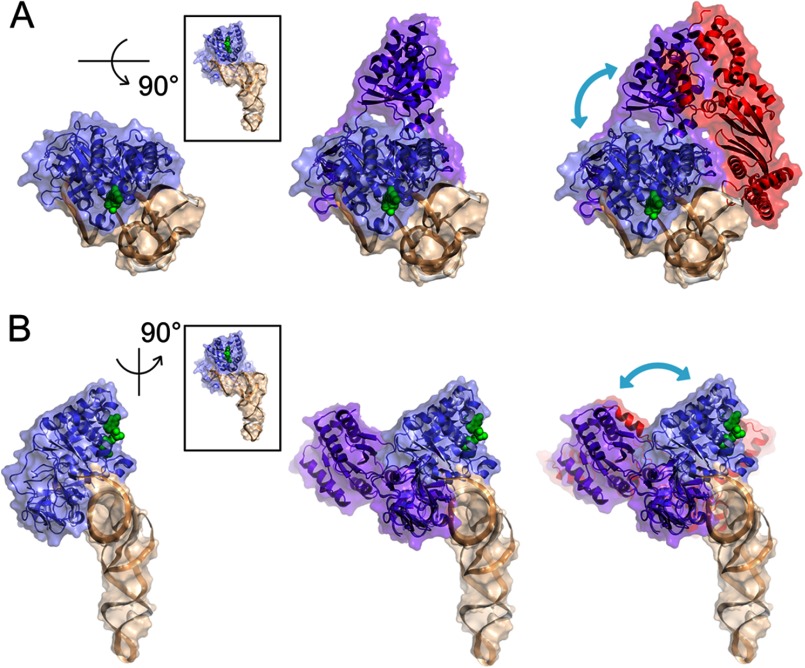
FIGURE 8.
Hypothetical EF-Tu·GTP·EF-Ts·Phe-tRNAPhe quaternary complex. A, a top-down perspective of the EF-Tu·GTP·Phe-tRNAPhe ternary complex (Protein Data Bank code 1OB2) showing EF-Tu (blue) bound to Phe-tRNAPhe (wheat) and GDPNP (green spheres). Here, the center panel shows an extended conformation (purple) of EF-Tu as it is observed in the E. coli EF-Tu·EF-Ts crystal structure (Protein Data Bank code 1EFU) where domains 2 and 3 of both EF-Tu structures are superimposed (N, Cα, CO, O root mean square deviation is 0.886 Å). The right panel highlights the position of EF-Ts (red) in a quaternary complex if its interactions with EF-Tu are identical to those observed in the E. coli EF-Tu·EF-Ts crystal structure. This model reveals only minor steric clashes between EF-Ts and the D-stem of the tRNA. The blue arrow indicates the hypothesized motions of the G domain of EF-Tu during ternary complex formation and decay. B, identical structures as in A from the perspective of looking down the axis of the tRNA acceptor stem. Structures were analyzed and rendered in PyMOL.

