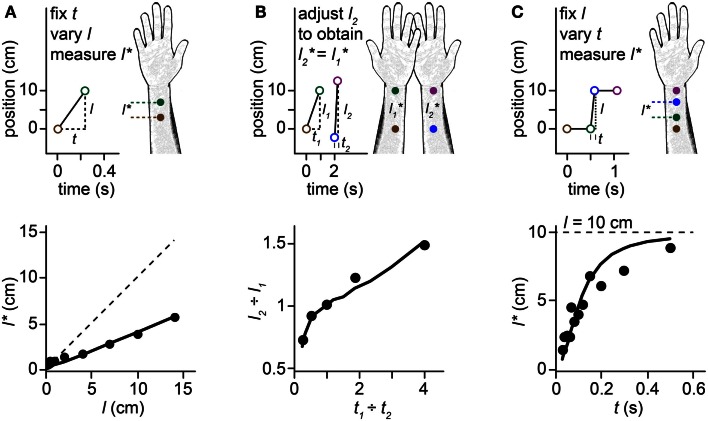
Figure 1.
Perceptual length contraction. Perception underestimates the distance between successive taps to the skin. Stimuli on the forearm are illustrated in the upper panels, along with their perception (forearm sketches). Corresponding human data and Bayesian model fits are plotted in the lower panels. In this and subsequent figures, we illustrate stimulus sequences that progress distally on the arm; the illusions occur also for stimuli in the opposite direction. (A) Top: at short ISI (t), the perceived length (l*) between two taps to the forearm is less than the actual length (l). Bottom: perceived length grows linearly with actual length, but with a slope less than 1. Filled circles: human perceptual data from Marks et al. (1982) for electrocutaneous stimuli delivered at t = 0.24 s. Solid line: fit of the Bayesian model. Dashed line: l = l*. (B) Top: a pair of taps delivered to the right forearm at short ISI (t2) is perceived to have the same spacing as a more closely spaced pair of taps (l1 < l2) delivered to the left forearm at longer ISI (t1 > t2). Bottom: the spacing ratio, l2-to-l1, resulting in perceived equality of spacing on the two arms, as a function of the ISI ratio, t1-to-t2. Filled circles: human perceptual data from Lechelt and Borchert (1977). Curve: fit of the Bayesian model. Data points from left to right had t1 = 0.2, 0.35, 0.5, 0.65, and 0.8 s, with t2 = 1.0 s − t1, and l1 = 10 cm. (C) Top: 4 taps delivered to two skin sites are perceived as hopping sequentially along the arm, because the short ISI (t) between taps 2 and 3 results in contraction of the perceived distance between them (l* < l). Bottom: the perceived length from taps 2–3 asymptotically approaches the actual length (l = 10 cm, dashed line) as ISI is increased. Filled circles: human perceptual data from Kilgard and Merzenich (1995). Curve: fit of the Bayesian model.

