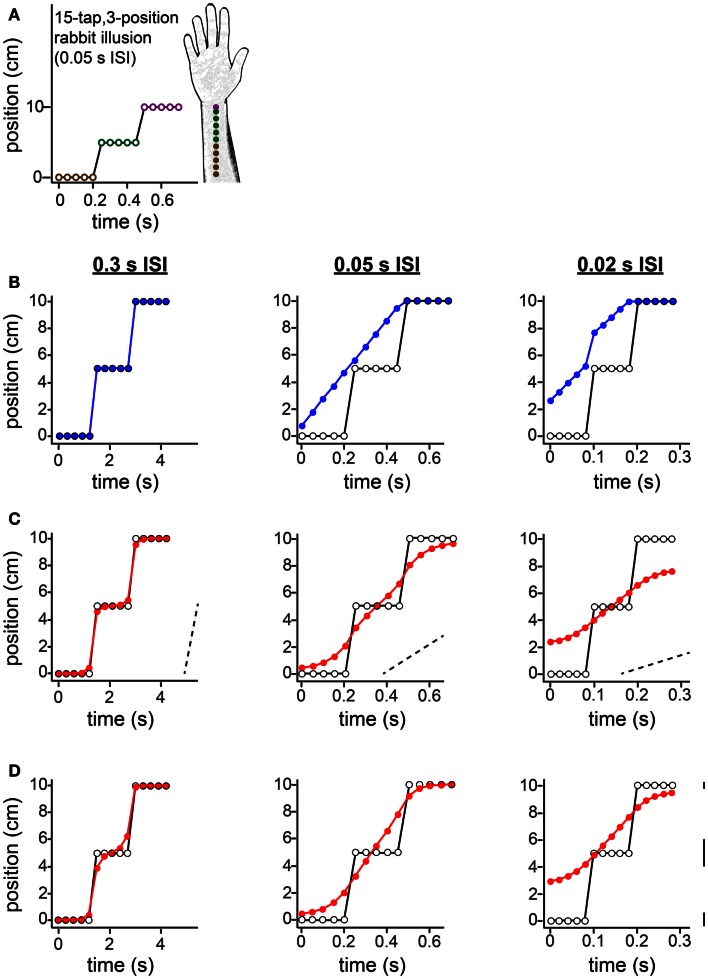
Figure 11.
The 15-tap rabbit illusion. (A) Geldard (1982) delivered five taps at each of three locations along the arm. When ISI between successive taps was 0.05 s, participants reported perceiving a linear spatial progression of taps 1 through 10 (forearm sketch). (B) The same spatial sequence shown in (A), at three different ISIs, resulted in distinct percepts (Geldard, 1982). Left: at 0.3 s ISI, perception was veridical. Center: at 0.05 s ISI, perception was as shown in (A). Right: at 0.02 s ISI, the taps were perceived to begin at a position between 2 and 3 cm along the arm, and to advance in a non-linear spatial progression. Open circles: true tap positions; blue points: human perceptual report. (C) The Bayesian low-speed observer’s perception with a standard setting of τ = 0.10 s (e.g., σs = 1 cm, σv = 10 cm/s) shows much similarity to participants’ subjective reports. Open circles: true tap positions; red points: Bayesian observer’s perception (mode of the posterior). Dashed slanted lines have slope 10 cm/s (i.e., 1σv). Note that the two rapid jumps in the true trajectory (from tap 5 to tap 6, and from tap 10 to tap 11) occur at a speed much greater than σv when the ISI is 0.05 s (center) or 0.02 s (right); thus, perceptual length contraction occurs in these cases. In contrast, at an ISI of 0.3 s (left), the trajectory does not strongly violate the observer’s low-speed expectation; thus, perception is nearly veridical. (D) The Bayesian low-speed observer’s perception can be made even closer to human reports if the value of σs varies along the arm. The observer’s percept at each ISI is shown for σs = 1, 2, and 0.5 cm around the proximal, middle, and distal arm regions, respectively. Line segments at right have length equal to 1σs at each location. The value of σv was fixed at 10 cm/s.

