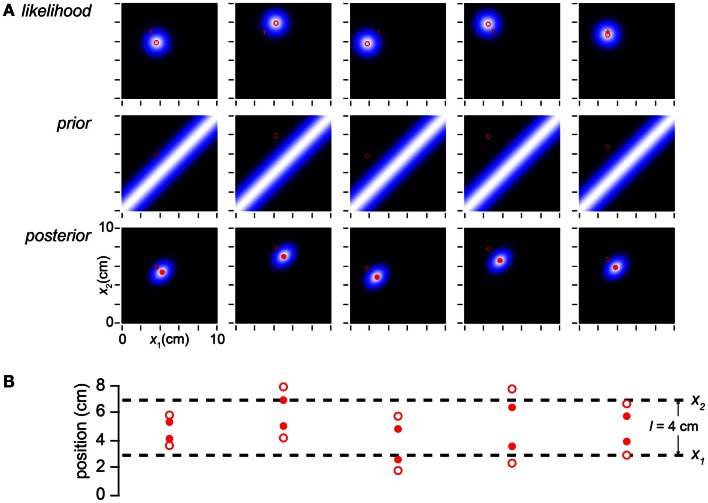
Figure 6.
Measurement noise causes stochastic perception. (A) The columns display the observer’s likelihood function, prior probability distribution, and posterior probability distribution on five trials with the identical stimulus trajectory: x1 = 3 cm, x2 = 7 cm, t = 0.15 s. Each measured stimulus position was randomly sampled from the true location; thus, the measured trajectory (x1m, x2m; open red circle) bounces randomly from trial to trial around the fixed true value (3, 7 cm; red cross). Because the likelihood function is centered on the measurement, it too bounces. Consequently, the observer’s percept (mode of the posterior, filled red circle) varies stochastically from trial to trial. (B) The measured tap positions (open circles) and perceived tap positions (mode of posterior, filled red circles) on each trial, compared to the actual tap positions (dashed lines). On every trial, the perceived trajectory length (l*, distance between filled circles) underestimates the measured length (lm, distance between open circles); the perceived trajectory length therefore on average underestimates the actual trajectory length (l).

