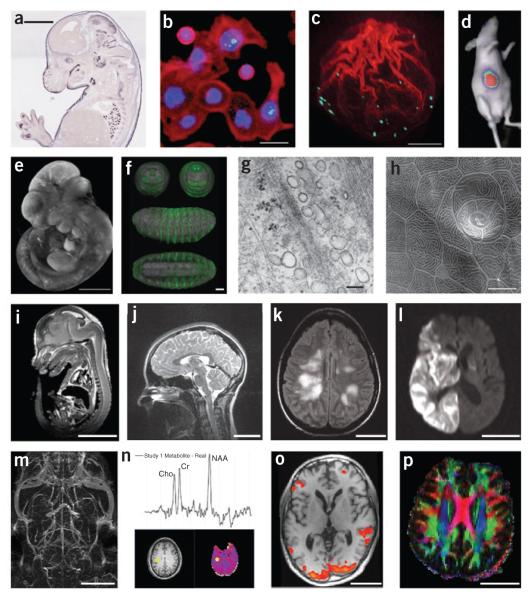
Figure 1.
Imaging techniques. (a) Brightfield microscopy: mouse embryo, in situ expression pattern of Irx1, Eurexpress; scale bar, 2 mm. (b) Fluorescence microscopy: HT29 cells stained for DNA (blue), actin (red) and phospho-histone H3 (green)75; scale bar, 20 μm. (c) Confocal microscopy: actin polymerization along the breaking nuclear envelope during meiotic maturation of a starfish oocyte. Actin filaments, red (rhodamine-phalloidin stain); chromosomes, cyan (Hoechst 33342 stain). Projection of confocal sections, (image courtesy P. Lénárt); scale bar, 20 μm. (d) Bioluminescence imaging: in vivo bioluminescence imaging of mice after implantation of Gli36-Gluc cells76, (figure courtesy B.A. Tannous). (e) Optical projection tomography: mouse embryo, EMAP33,66; scale bar, 1 mm. (f) Single/selective plane illumination microscopy: late-stage Drosophila embryo probed with anti-GFP antibody and DRAQ5 nuclear marker: frontal, caudal, lateral and ventral views of the same embryo77; scale bar, 50 μm. (g) Transmission electron microscopy: human fibroblast, glancing section close to surface (image courtesy R. Parton and M. Floetenmeyer); scale bar, 100 nm. (h) Scanning electron microscopy: zebrafish peridermal skin cells (courtesy R. Parton and M. Floetenmeyer); scale bar, 10 μm. (i) microMRI: mouse embryo (source: http://mouseatlas.caltech.edu/); scale bar, 5 mm. (j) T2-weighted MRI: human cervical spine (source: http://www.radswiki.net/); scale bar, 5 cm. (k) Fluid attenuation inversion recover (FLAIR) image of a human brain with acute disseminated encephalomyelitis. Bright areas indicate demyelination and possibly some edema (image courtesy N. Salamon); scale bar, 5 cm. (l) Diffusion-weighted image of a human brain after a stroke. Bright areas indicate areas of restricted diffusion (image courtesy N. Salamon); scale bar, 5 cm. (m) Maximum intensity projection image of a magnetic resonance angiogram of a C57BL/6J mouse brain acquired in vivo using blood pool contrast78 (image courtesy G. Howles); scale bar, 5 mm. (n) 3D proton magnetic resonance spectroscopic imaging study of normal human brain. Graph shows proton spectrum for the brain location identified by yellow markers on the T1-weighted MRI (lower left) and N-acetylaspartate (NAA; lower right) images. Data acquired using the MIDAS/EPSI methodology79 (image courtesy J. Alger); scale bar, 5 cm. (o) Functional MRI activation map overlaid on a T1-weighted MRI: human brain (image courtesy L. Foland-Ross); scale bar, 5 cm. (p) Direction-encoded color map computed from DTI. Red, left–right directionality; green, anterior–posterior; blue, superior–inferior; scale bar, 5 cm.

