Figure 2.
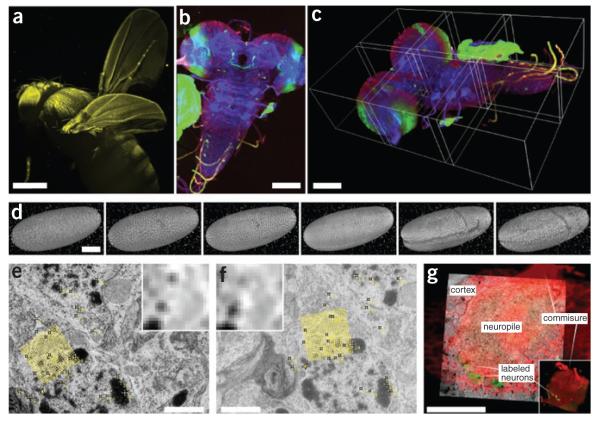
Visualization of high–dimensional image data. (a) SPIM scan of autofluorescent adult Drosophila female gives an impression of 3D rendering in maximum intensity projection (image courtesy D.J. White); scale bar, 100 μm. (b) Maximum-intensity projection of tiled 3D multichannel acquisition of Drosophila larval nervous system; scale bar, 400 μm. (c) The corresponding 3D rendering in Fiji 3D viewer; borders of the tiles are highlighted; scale bar, 100 μm. (d) Visualization of gastrulation in Drosophila expressing His-YFP in all cells by time-lapse SPIM microscopy. The images show six reconstructed time points covering early Drosophila embryonic development rendered in Fiji 3D viewer. Fluorescent beads visible around sample were used as fiduciary markers for registration of multi-angle SPIM acquisition; scale bar, 100 μm. (e,f) Two consecutive slices from serial section transmission electron microscopy dataset of first-instar larval brain. Yellow marks, corresponding SIFT features that can be used for registration; yellow grid, position and orientation of one of the SIFT descriptors; inset, corresponding pixel intensities in the area covered by the descriptor; scale bar, 1 μm. (g) Multimodal acquisition of Drosophila first-instar larval brain by confocal (red, green) and electron microscopy (underlying gray). The two separate specimens were registered using manually extracted corresponding landmarks (not shown). Main anatomical landmarks of the brain correspond in the two modalities after registration (white labels). (Electron microscopy images courtesy A. Cardona; confocal image courtesy V. Hartenstein). Scale bar, 20 μm.

