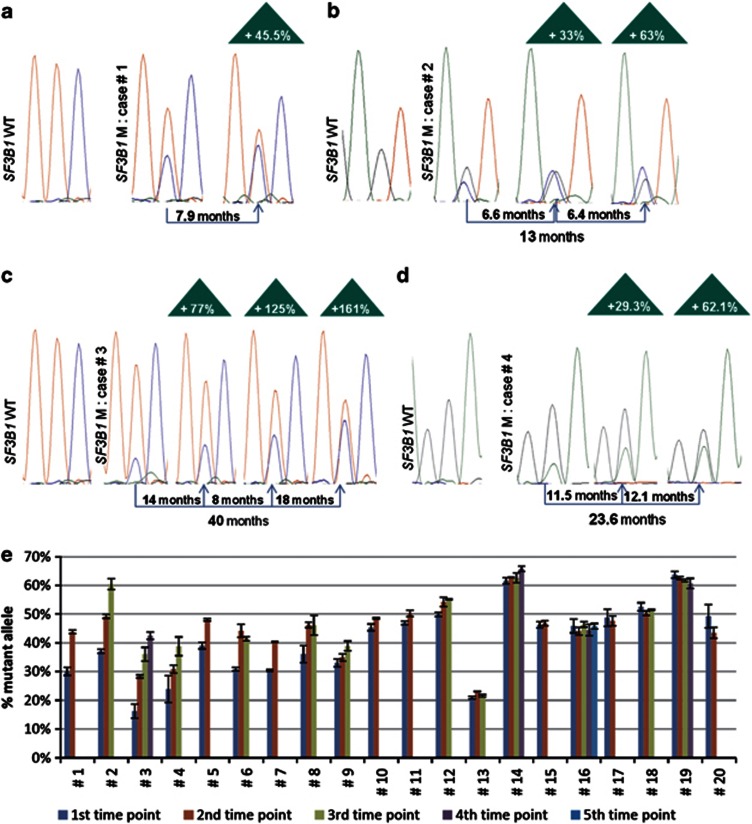
Figure 1.
Evolution of SF3B1 mutations over time. (a–d) Representation of the serial sample sequence chromatograms for patient no. 1, 2, 3 and 4, respectively. The time intervals between each time point are indicated as well as the overall time span studied. The percentage of increase over time of the SF3B1-mutant allele is indicated in the triangles and is calculated by comparison with the first time point. (e) Bar graph representing the percentage of SF3B1-mutant allele measured at each time points for all the 20 SF3B1-mutant cases included in the serial analysis. The 20 cases are ranked by their increase/months (%), according to Table 1. Each time point has been sequenced in duplicate, and the error bars represent the mean±s.d.

