
Figure 5.
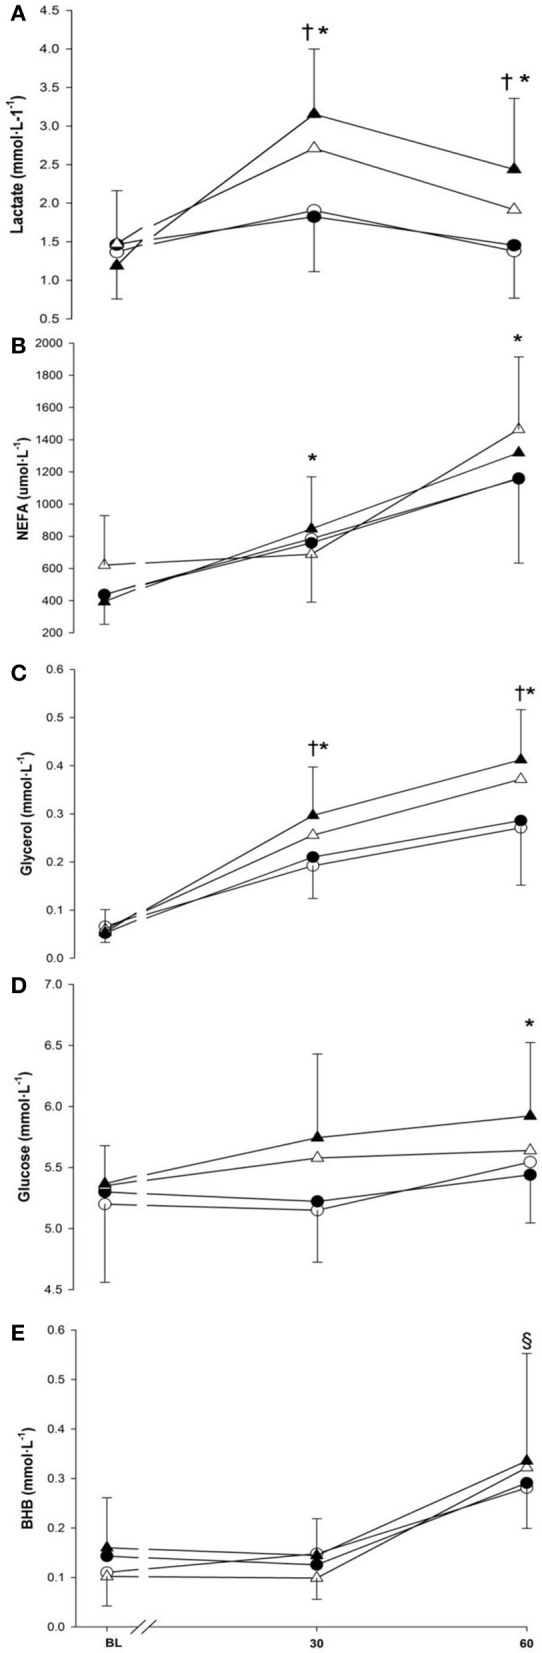
Lactate (panel A), non-esterified fatty acids (panel B), glycerol (panel C), glucose (panel D) and beta-hydroxybutyrate (panel E) at baseline (BL) and during 60-min of exercise during walking (○ and •) and running (Δ and ▲), in cold (○ and Δ), and neutral (• and ▲) ambient temperatures. Mean (±SD). †Significant difference between walking and running (P < 0.01). *Significantly greater than baseline (P < 0.05). §Significantly greater than baseline and 30 min (P < 0.001).