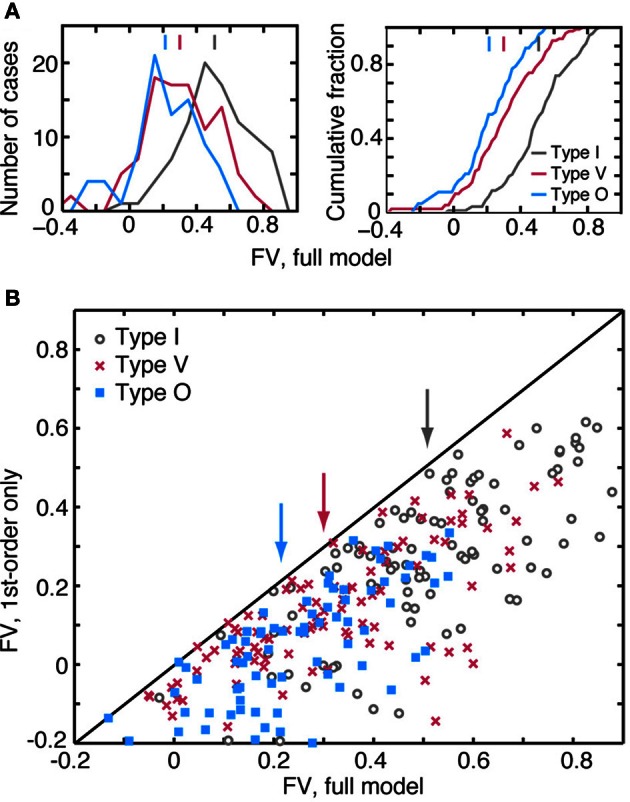
Figure 7.

Quality of the model predictions as measured by fv in leave-one-out cross validation tests. Each plot contains an aggregation of prediction data obtained at different sound levels. A neuron is usually represented multiple times, once at each sound level and also at pairs of adjacent sound levels. (A) Distribution (left) and cumulative distribution (right) of fv-values for the three response types. Vertical lines at the top of the plots show median fv-values. Differences in the distributions across the neuron types are statistically significant (rank sum test with Bonferroni correction; I vs. V and I vs. O, P << 0.001; V vs. O, P < 0.02). (B) Comparison of the best prediction quality (fv) for a full binaural model containing all 2nd-order terms (abscissa) and a model containing only 1st-order terms (ordinate). Ten data points with ordinate values <−0.2 are not shown, but are included in the statistics. Vertical arrows indicate median fv-values for each of the neuron types.
