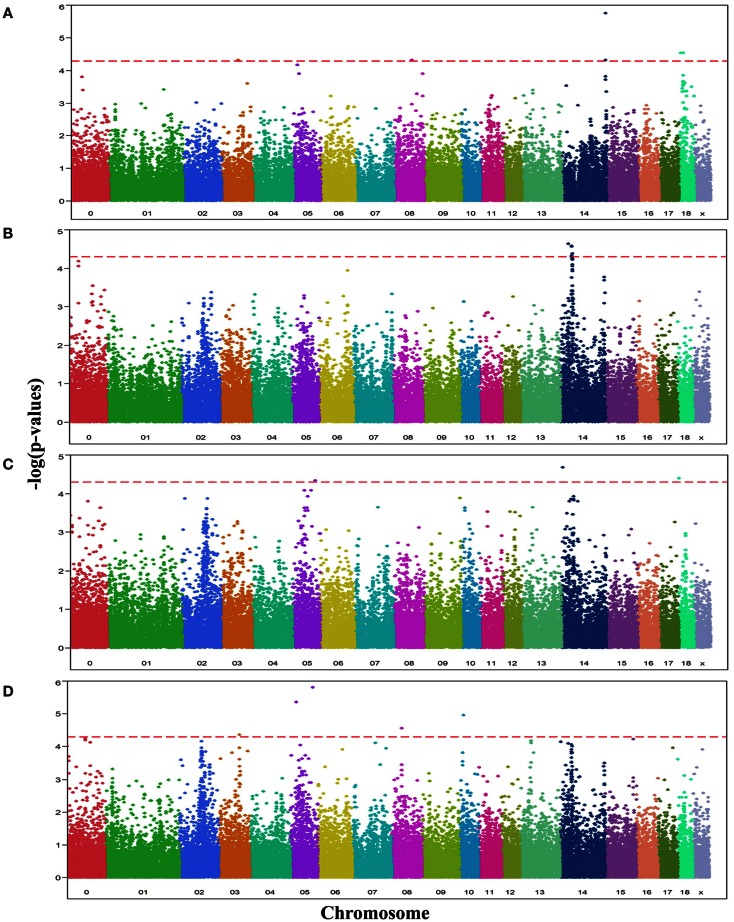
Figure 1.
Manhattan plots displaying the significance of associations of SNPs with OC lesion scores at (A) medial part of condylus humeri (CMH), (B) condylus medialis femoris (CMF), (C) distal epiphyseal cartilage of ulna (DEU), and (D) category of OC (OCcat). The p-values (−log10 transformed) on the vertical axis are plotted against the genomic position of SNPs on the horizontal axis. The horizontal dashed line indicates the genome-wide significance level (q-value ≤ 0.1).

