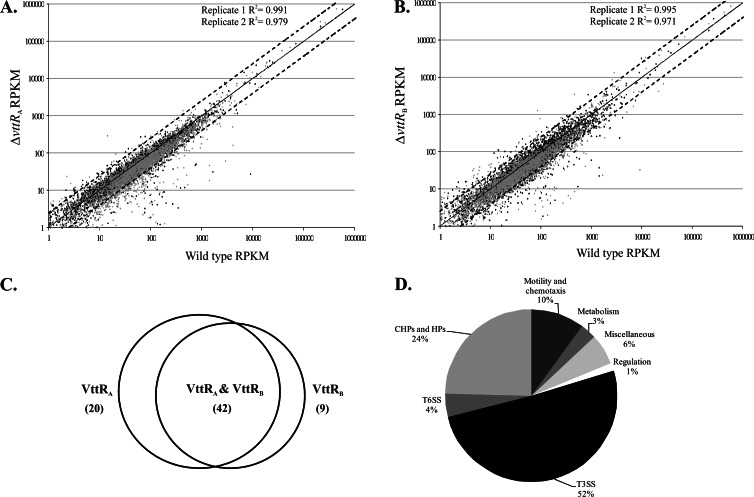
Fig 1.
VttRA and VttRB transcriptome. (A and B) Scatter plot depicting RPKM values for wild-type and ΔvttRA strains (A) and wild-type and ΔvttRB strains (B) across two independent samples (black and gray). Each data point represents an RPKM value of ≥1 for a specific locus tag/ORF. Solid lines represent x = y, and the dotted lines above and below depict y = 2.5x and x = 2.5y, respectively. R is the coefficient of correlation. (C) Venn diagram depicting genes with reduced expression in the ΔvttRA and ΔvttRB strains. A total of 71 genes are differentially expressed with ≥2.5-fold reduction in expression levels compared to the wild-type strain. (D) Differentially expressed genes in ΔvttRA and ΔvttRB strains potentially categorized according to function.

