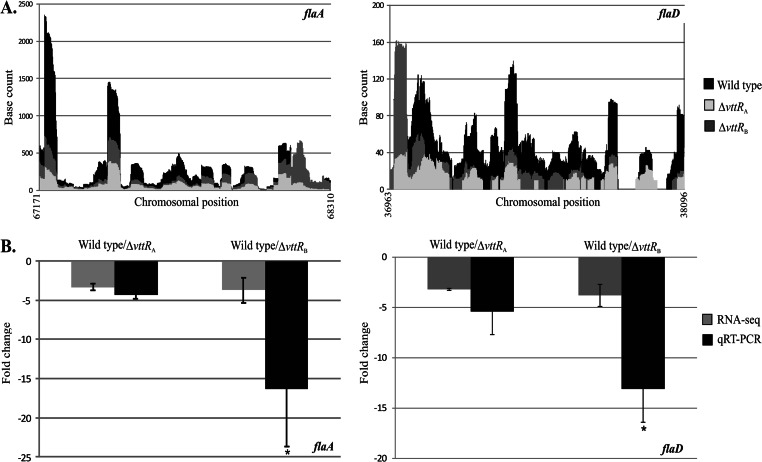
Fig 3.
VttRA and VttRB influence transcription of flaA and flaD. (A) Raw RNA-seq data obtained from .wig files indicating the number of times each base was mapped for flaA and flaD in the wild-type and deletion backgrounds. (B) qRT-PCR analysis of flaA and flaD transcript levels in the wild-type and ΔvttRA and ΔvttRB strains. Mean fold change values obtained from qRT-PCR are shown adjacent to the mean fold change obtained from RNA-seq. qRT-PCR was performed four times on RNA used for RNA-seq and independently isolated RNA. Error bars represent standard deviations. *, P < 0.05 compared to the wild-type strain.

