Fig 1.
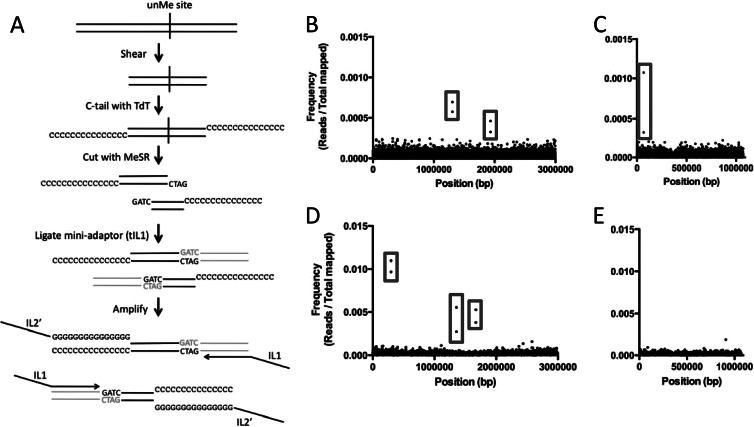
Identification of undermethylated Dam and VchM sites in V. cholerae. (A) Using an unmethylated Dam site, we diagram the methyl HTM-seq protocol used to identify undermethylated sites in the genome. Genomic DNA is shown as black lines, while the adaptor (tIL1) is shown in gray. (B to E) Visual representation of Dam (B and C) and VchM (D and E) methyl HTM-seq data. Frequencies of mapped Illumina reads (y axis) are plotted against the V. cholerae genome (x axis) for chromosome I (B and D) and chromosome II (C and E). Examples of paired reads that make up a single undermethylated Dam site are highlighted by gray boxes.

