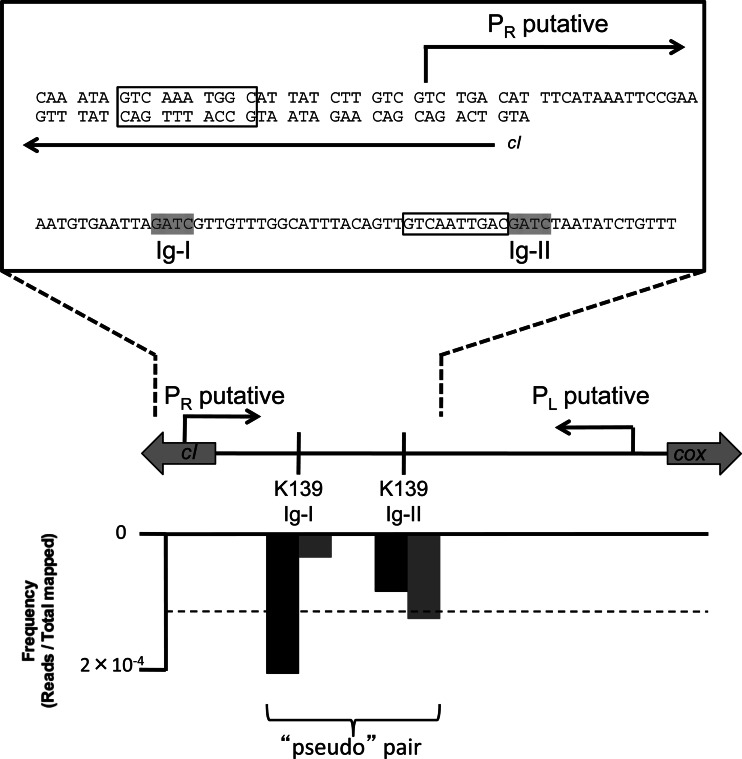
Fig 2.
The genetic architecture of undermethylated Dam sites in the K139 prophage. Shown is the structure of the intergenic region between the outward-facing genes encoding cI and Cox. Putative PL and PR sites were annotated by Nesper et al. (32). PL drives the expression of cI, and PR drives the expression of cox. Above the gene layout is a zoomed inset showing the sequence of putative cI operator sites (boxed) and the undermethylated Dam sites Ig-I and Ig-II (highlighted in gray). Below the gene layout is a graph plotting the frequency of mapped reads (y axis) against the genome (x axis) for the two Dam sites in this region from the methyl HTM-seq data set. Two bars are shown for each Dam site, representing the forward (gray) and reverse (black) reads that result from cleavage of each site. The dotted line on this graph represents the 99% cutoff value used as a measure of significant undermethylation in this experiment.

