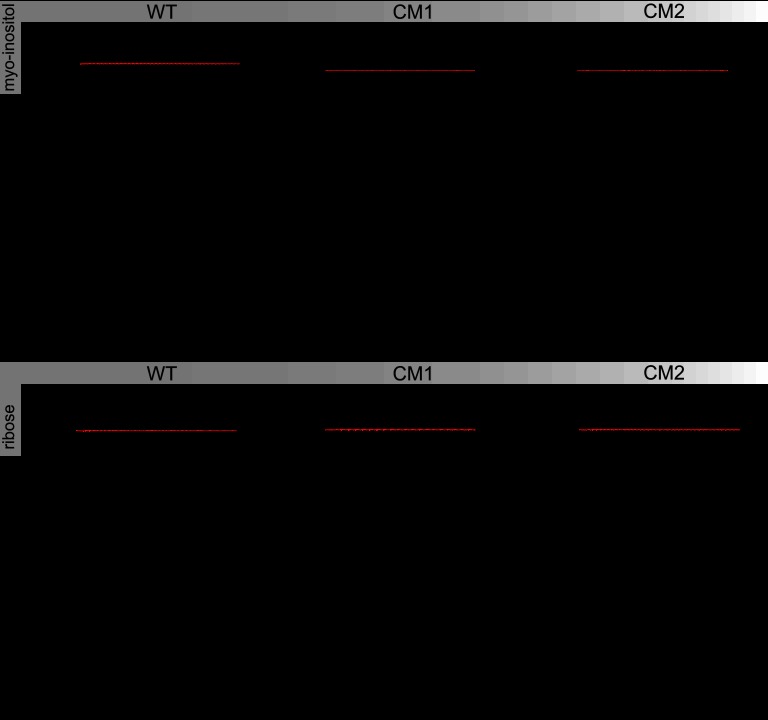
Fig 6.
ITC carbohydrate binding assays. In each panel, the raw heat signal is displayed above the integrated and fitted data (below). Equilibrium dissociation constants (Kd values) were calculated for each titration after subtraction of the buffer heat of dilution. (A) Binding interaction between IbpA and myo-inositol. WT, wild type. (B) Binding interaction between IbpACM1 and myo-inositol. (C) Binding interaction between IbpACM2 and myo-inositol. (D) Binding interaction between IbpA and d-ribose. (E) Binding interaction between IbpACM1 and d-ribose. (F) Binding interaction between IbpACM2 and d-ribose.

