
Figure 2.
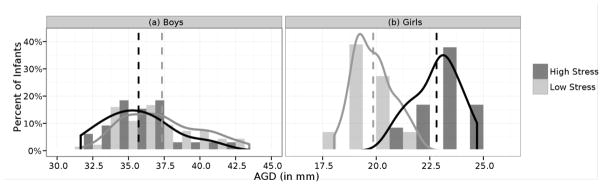
Distribution of age- and weight-percentile-adjusted (a) AGD-AS (in mm) in infant boys (n=137), and (b) AGD-AF (in mm) in infant girls (n=136); in relation to prenatal life events stress reported by their parents. Mean AGD for high and low life events stress groups indicated by vertical dotted lines. Solid lines indicate smoothed Gaussian kernel densities.