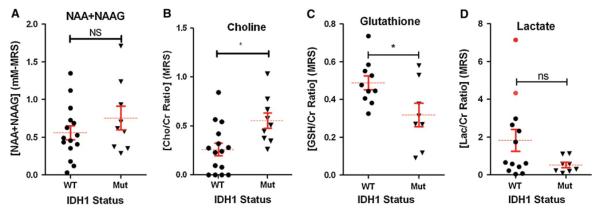
Fig. 4.

Metabolite levels in IDH1 wild-type vs. IDH1 mutant gliomas. Levels of A N-acetyl-aspartate (NAA), B choline (Cho), C glutathione (GSH), and D Lactate (Lac) were determined by MRS and quantified using LC-Model software. Metabolite ratios are represented with respect to the total concentrations of Cr. *P = 0.01 for Cho and P = 0.03 for GSH. Red dots represent wild-type samples with artifactually detectable 2-HG on MRS and high lactate levels, showing the metabolic profile of the “false positive” cases
