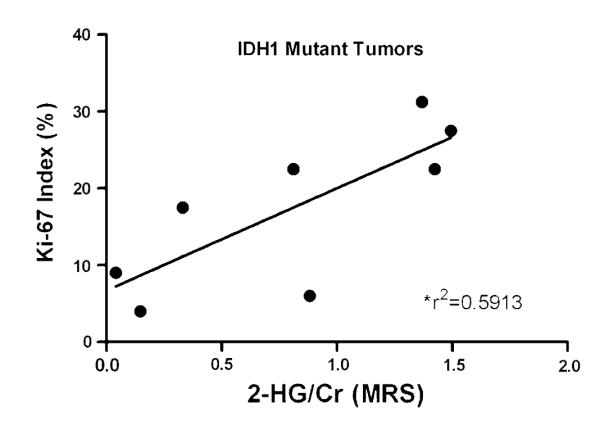
Fig. 5.

Relationship between Ki-67 proliferation index and 2-HG concentration. For the mutant IDH1 tumors (n = 9), the Ki-67 index for each tumor sample was determined by immunohistochemistry and compared to 2-HG concentrations calculated by MRS analysis. Correlation coefficients were calculated and are shown with a linear regression line drawn (P = 0.026)
