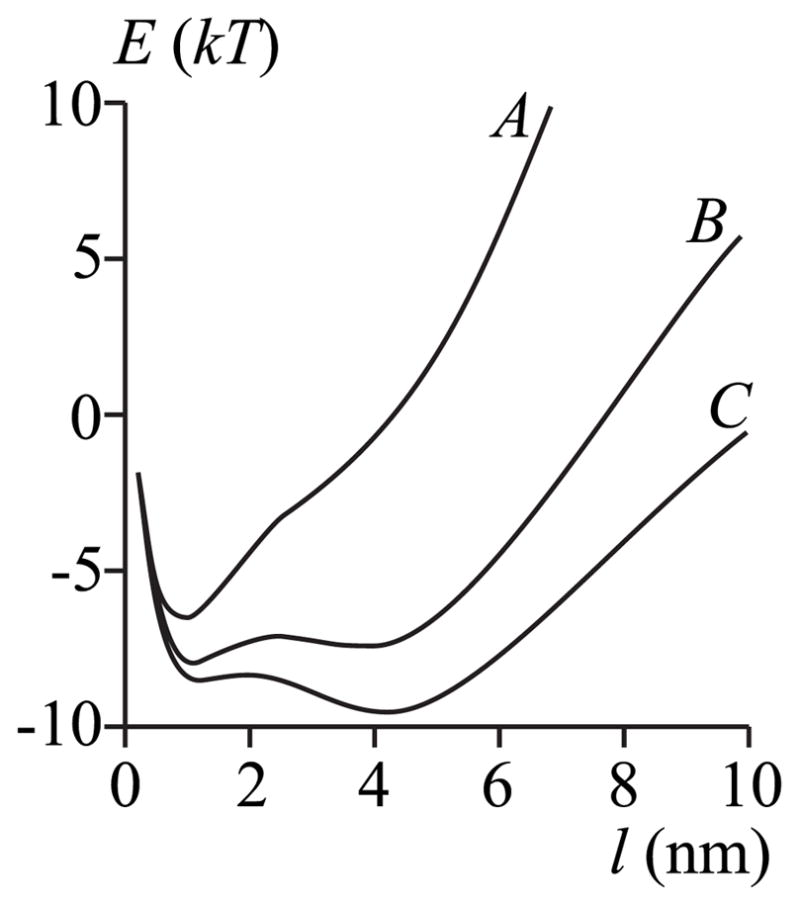
FIG. 5.

The work E to create a film of thickness l. Curves A – C represent different membrane subsaturations corresponding to those of the horizontal dashed lines in Fig. 4: curve A, Δ = 1%; curve B, Δ = 0.4%; curve C, Δ = 0.2%. The parameters are those of curve C of Fig. 4, Jr = Js = 0, hp = hr = 2.5 nm, hs = 2.0 nm, and rp = 20 nm.
