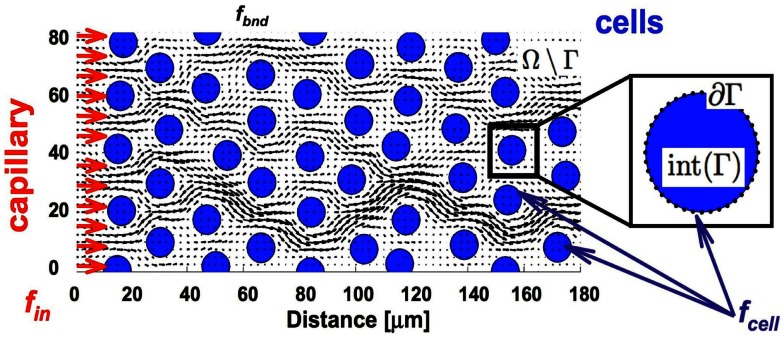
Figure 2.
Tissue scheme in the model. Schematic representation of the computational domain containing several tumor cells (blue circles) surrounded by the interstitial fluid (black arrows) that is supplied from the capillary located at the left border of the domain (red arrows). Adequate forces (fin and fbnd) are chosen to create the physiological fluid flow and to keep the boundaries of all tumor cells immobile (fcell).

